
Real-time quantitative PCR array to study drug-induced changes of gene expression in tumor cell lines


Abstract
Aim: Reverse transcription-quantitative polymerase chain reaction (RT-qPCR) is still the “gold standard” for quantitative analysis of mRNA and the study of differentially expressed genes.
Methods: The authors describe a RT-qPCR array that exploits SYBR Green dye-based detection to perform reliable gene expression analysis on 41 genes involved in several pathways linked to DNA damage response, cell cycle progression, cellular senescence, and programmed cell death. To validate the RT-qPCR array, the authors investigated changes of the gene expression profile of HeLa cells treated with two well-characterized antiproliferative molecules such as cisplatin (CDDP) and sodium butyrate (NaBu).
Results: The results showed a gene expression profile compatible with both biological and gene expression data already reported in literature.
Conclusion: Importantly, the assay allowed the monitoring of additional and not reported gene regulations, indicating that this custom-made RT-qPCR array is a cheap, robust, and rapid tool for the study of drug-induced effects in human biological models.
Keywords
Introduction
The study of gene expression profile of cancer cells has become an essential tool to understand the biological alterations involved in disease development, to individuate new potential markers, to predict clinical outcome, to create personalized pharmacological therapies for patients, and to investigate the molecular effects of drug exposure with the aim of improving treatment efficacy.[1]
Reverse transcription-quantitative polymerase chain reaction (RT-qPCR)-based methods has emerged as the “gold standard” method for a rapid and robust analysis of gene expression.[2] Currently, many PCR arrays are commercially available for the study of gene expression modifications involved in hundreds of molecular pathways. However, based on our experience, many of these RT-qPCR arrays are characterized by technical limits that could compromise the success of a gene expression study. The first limit is represented by the absence of technical replicates that could monitor the inter-well reproducibility for each gene transcript. The amplification of each target in a single well does not allow one to identify possible incidental mistakes that can occur, for example, during preparation of the PCR reaction mix. Another critical aspect is amplification of genes expressed at very low levels (e.g. CDK inhibitors) that is often difficult and requires a highly efficient DNA polymerase. In fact, the different DNA polymerase master mixes commercially available are not always able to amplify very low represented mRNA species in a detectable way.
The rationale of the study was to design and test a RT-qPCR array able to analyze the behaviour of 41 human genes involved in cell cycle regulation, DNA damage response, apoptosis, and senescence induction. Our goal was to develop a qPCR array that could overcome the technical limits described above (e.g. low efficiency of amplification and technical replicates controls) in order to obtain an inexpensive and easy-to-use tool for the reliable monitoring of transcriptional modulations induced by exposure of human cells to drug treatments.
We applied this qPCR array to investigate the response of HeLa cells to two different anti-proliferative drugs such as cisplatin [cis-diamminedichloroplatinum(II)-CDDP] and sodium butyrate (NaBu). CDDP remains one of the principal chemotherapeutic agents used for cancer treatment. CDDP cytotoxicity is mediated by its ability to form DNA adducts, primarily intra-strand adducts, which activate a DNA-damage cellular response and subsequent programmed cell death.[3,4] Cellular exposure to CDDP, for example, is known to cause up-regulation of cyclin dependent kinase inhibitors (e.g. p27 and p21) and down-regulation of anti-apoptotic protein Bcl2 in cancer models.[5,6] NaBu is a widely known histone deacetylase inhibitor and is considered the prototype of an epigenetic modulator. NaBu exerts anticancer effects by inhibiting histone deacetylase enzymes, thus inducing increased histone acetylation levels, elaboration of chromatin structure, and consequent reactivation of aberrantly silenced genes.[7] Previous studies showed that several molecular pathways are affected by NaBu treatment. In particular, cyclin dependent protein kinase (CDK) down-regulation,[8] cell-cycle inhibitors up-regulation, together with modulation of several apoptosis-related genes were observed.[9,10]
Finally, the described modulation of gene expression induced in HeLa cells, when subjected to CDDP or NaBu exposure, was compared with the results obtained by our RT-qPCR array using the same biological model of study.
Methods
Cell culture and treatments
HeLa cells were obtained from the American Type Culture Collection (ATCC, Rochville, MD, USA). All cellular populations were cultured in Dulbecco’s Modified Eagle Medium (DMEM, Cambrex, Walkersville, MD, USA) supplemented with 10% fetal bovine serum (FBS), 1% penicillin-streptomycin, and 1% glutamine.
HeLa cells in exponential phase of growth were subjected to treatment with 10 µmol/L CDDP (Sigma-Aldrich, St Louis, MO, USA) or 5 mmol/L NaBu for 24 h and 16 h, respectively. At the end of the treatment period, viability of cellular populations was analyzed by the trypan blue dye exclusion method.[11]
Primers design
Primer pairs, purchased from Primm S.r.l. (Milan, Italy) and listed in Table 1, were designed with Primer Express 2.0 Abi Prism software (PE Applied Biosystem, Foster City, CA, USA) as previously described,[12] employing common design parameters [Table 2]. All amplicons primers, except for those amplifying an intronic region of GAPDH (control for possible genomic DNA contamination), were designed encompassing exon-exon boundaries to avoid genomic DNA amplification. The specificity of amplicons and primer pairs was checked in silico using BLAT (UCSC Genome Browser) and BLAST (National Center for Biotechnology Information) alignment tools.
List of genes amplified, relative primers, and main pathways
| Gene | Forward primer | Reverse primer | Length | Pathwaysa |
|---|---|---|---|---|
| ABL1 | 5’-TACCCGGGAATTGACCTGTC | 5’-GGATTTCAGCAAAGGAGGGC | 151 | Cell cycle |
| ATM | 5’-GGTATAGAAAAGCACCAGTCCAGTATTG | 5’-CGTGAACACCGGACAAGAGTTT | 152 | DNA damage |
| ATP5B | 5’-GTCTTCACAGGTCATATGGGGA | 5’-ATGGGTCCCACCATATAGAAGG | 122 | Housekeeping |
| ATR | 5’-AGTAGCTTCCTTTCGCTCCAAA | 5’-ACTGACTCCGGCCACTCCAT | 154 | DNA damage |
| BAX | 5’-CAAACTGGTGCTCAAGGCCC | 5’-GGGCGTCCCAAAGTAGGAGA | 151 | Apoptosis |
| BCL2 | 5’-CTGGTGGACAACATCGCCCT | 5’-TCTTCAGAGACAGCCAGGAGAAAT | 151 | Apoptosis |
| BIRC5 | 5’-CCGGTTGCGCTTTCCTTTC | 5’-CGCACTTTCTCCGCAGTTTC | 151 | Apoptosis |
| BRCA1 | 5’-GCATGCTGAAACTTCTCAACCA | 5’-GTGTCAAGCTGAAAAGCACAAATGA | 151 | DNA damage |
| BRCA2 | 5’-AGACTGTACTTCAGGGCCGTACA | 5’-GGCTGAGACAGGTGTGGAAACA | 151 | DNA damage |
| CCNA2 | 5’-AGTAAACAGCCTGCGTTCACC | 5’-GAGGGACCAATGGTTTTCTGG | 151 | Cell cycle |
| CCNB1 | 5’-ATGACATGGTGCACTTTCCTCC | 5’-GCCAGGTGCTGCATAACTGG | 151 | Cell cycle |
| CCNB2 | 5’-GATAACGAAGATTGGGAGAACCC | 5’-CCACTAGGATGGCACGCATG | 151 | Cell cycle |
| CCND1 | 5’-TGAAGGAGACCATCCCCCTG | 5’-TGTTCAATGAAATCGTGCGG | 151 | Cell cycle |
| CCNE1 | 5’-AAATGGCCAAAATCGACAGG | 5’-CGAGGCTTGCACGTTGAGTT | 151 | Cell cycle |
| CDC2 | 5’-ACAGGTCAAGTGGTAGCCATGA | 5’-ACCTGGAATCCTGCATAAGCA | 151 | Cell cycle |
| CDC16 | 5’-ATGCTGAGGCCTTGGATTACC | 5’-TCTCGCCTAAGACCAAGGGC | 151 | Cell cycle |
| CDC20 | 5’-AGATGGACGACATTTGGCCA | 5’-ATTGGACTGCCAGGGACACC | 151 | Cell cycle |
| CDC34 | 5’-GGATTCCGCGTGACACTGGT | 5’-ACCGAAAGGCTGGTGGAGAG | 151 | Cell cycle |
| CDK2 | 5’-TTCTCATCGGGTCCTCCACC | 5’-TCGGTACCACAGGGTCACCA | 151 | Cell cycle |
| CDK4 | 5’-CTGTGCCACATCCCGAACTG | 5’-GCCTCTTAGAAACTGGCGCA | 151 | Cell cycle |
| CDK6 | 5’-CCGAAGTCTTGCTCCAGTCC | 5’-GGGAGTCCAATCACGTCCAA | 151 | Cell cycle |
| CDK7 | 5’-TCACATCTTCAGTGCAGCAGG | 5’-TGGCAGCTGACATCCAGGT | 151 | Cell cycle |
| CDK8 | 5’-AGCGGGTCGAGGACCTGTTT | 5’-CATGCCGACATAGAGATCCCAG | 151 | Cell cycle |
| CDKN1A | 5’-TACCCTTGTGCCTCGCTCAG | 5’-GGCGGATTAGGGCTTCCTCT | 151 | Cell cycle - senescence |
| CDKN1B | 5’-AGACTGATCCGTCGGACAGC | 5’-CACAGAACCGGCATTTGGG | 152 | Cell cycle - senescence |
| CDKN2A | 5’-CAACGCACCGAATAGTTACGG | 5’-CTGCCCATCATCATGACCTG | 54 | Cell cycle - senescence |
| CDKN2B | 5’-ATCCCAACGGAGTCAACCG | 5’-CTGCCCATCATCATGACCTG | 58 | Cell cycle - senescence |
| CDKN3 | 5’-TGAAGCCGCCCAGTTCAATA | 5’-CAACCTGGAAGAGCACATAAACC | 151 | Cell cycle |
| CHEK1 | 5’-GAGCGTTTGTTGAACAAGATGTG | 5’-GTTGGTCCCATGGCAATTCT | 151 | Cell cycle |
| CHEK2 | 5’-TCAGCAAGAGAGGCAGACCC | 5’-ACAGCTCTCCCCCTTCCATC | 151 | Cell cycle |
| CUL3 | 5’-GGTAAACCAACACAGCGGGT | 5’-CTGGGTCGGATTCACCTTGT | 151 | Cell cycle |
| DNMT1 | 5’-AGAACGCCTTTAAGCGCCG | 5’-CCGTCCACTGCCACCAAAT | 110 | Cell proliferation |
| E2F4 | 5’-GCATCCAGTGGAAGGGTGTG | 5’-ACGTTCCGGATGCTCTGCT | 151 | Cell cycle |
| GADD45A | 5’-GATGCCCTGGAGGAAGTGCT | 5’-GAGCCACATCTCTGTCGTCGT | 151 | Cell cycle - senescence |
| GAPDH | 5’-GCAAATTCCATGGCACCGT | 5’-TCGCCCCACTTGATTTTGG | 106 | Housekeeping |
| KNTC1 | 5’-ATAGTCAACCCAGAGTGGGCTGT | 5’-TTTCACGTTTTTCGTCCTGCG | 151 | Cell cycle |
| MCM2 | 5’-TGCCACTGTCATCCTAGCCA | 5’-GATGGAAGGAGCAATGCTGG | 151 | Cell cycle |
| MKI67 | 5’- TGTGCCTGCTCGACCCTACA | 5’-TGAAATAGCGATGTGACATGTGCT | 151 | Cell proliferation |
| PCNA | 5’-TTTGGTGCAGCTCACCCTG | 5’-CGCGTTATCTTCGGCCCTTA | 151 | Cell proliferation |
| RB1 | 5’-GACCCAGAAGCCATTGAAATCT | 5’-GGTGTGCTGGAAAAGGGTCC | 151 | Cell cycle |
| RPA3 | 5’-TTCGTAGGGAGGCTGGAAAA | 5’-CCTTGGCGGTTACTCTTCCAA | 151 | DNA damage |
| RPLP0 | 5’-TTCATTGTGGGAGCAGAC | 5’-CAGCAGTTTCTCCAGAGC | 156 | Housekeeping |
| TP53 | 5’-GCGTGTTTGTGCCTGTCCTG | 5’-TGGTTTCTTCTTTGGCTGGG | 151 | Cell cycle - senescence |
| UBA1 | 5’-CCATAAACGCCTTCATTGGG | 5’-TGGAGGCACTTGTCCTCTGTG | 151 | Cell cycle |
RNA extraction
Total RNA was extracted using the RNeasy Mini Kit (Qiagen, Hilden, Germany) and following supplier’s instructions. Elution was performed in a solution of 1 volume of PBS and 5 volumes of RNAlater. For total RNA extraction RNase-free water and RNase-free supplies were used. Total RNA concentration was measured with Qubit Fluorometer (Invitrogen, Carlsbad, CA, USA) and RNA integrity evaluated through 1.3% agarose gel electrophoresis, as described.[13]
Reverse transcription
One microgram of RNA from each sample was retrotranscribed (RT) using SuperScript II Reverse Transcriptase (Invitrogen, Carlsbad, CA, USA) and T Personal thermocycler (Biometra), according to manufacturer’s protocol. Briefly, the RT assay was conducted with 1 µL Oligo (dT) 500 mg/mL, 1 µL dNTPs mix 10 mmol/L, each, 1 µg of total RNA and sterile RNase-free water up to 13 µL final volume. The RT mix was heated to 65 °C for 5 min, enriched with 4 µL of first-strand buffer 5 × and 2 µL of DTT 0.1 mol/L, and then incubated at 42 °C for 2 min with addition of 1 µL SuperScript II RT. Lastly, 20 µL of final solution was incubated at 42 °C for 50 min and successively warmed up to 72 °C for 15 min.
Quantitative real-time PCR
Quantitative real-time PCRs (qPCR) were performed with Rotor-Gene 6000 (Corbett Life Sciences, Sydney, Australia) in 100-wells Gene Discs, using a final volume reaction of 15 µL containing 0.3 µmol/L of each forward and reverse primer, 1 × SYBR Green mastermix (as indicated in Results section) and 0.2 µL of cDNA solution, as described.[14] The following thermal profile was applied: 1 cycle at 95 °C for 10 min, 40 cycles at 95 °C for 10 s, 64 °C for 30 s, and 72 °C for 15 s. Melting curve analysis was performed ramping from 60 °C to 90 °C and rising by 0.5 °C every 2 s.
Gene expression variations were evaluated in term of fold induction respect to the untreated cellular population (control) by both the 2-∆∆CT method and ‘Comparative Quantitation’ tool of the Rotor Gene 6000 Series software 1.7. Expression stability values of the different housekeeping genes were calculated by Norm Finder software[15] to choose the best reference gene for normalization. Filtering of results was carried out as follows: genes were considered differently expressed when their change was greater than ± 2.5 fold respect to the transcript levels of untreated sample, as already described.[16] All experiments were conducted in triplicate.
Results
RT-qPCR array design
The RT-qPCR array was developed to study modulation of transcript abundance of 41 human genes involved in regulation of key cellular pathways, such as cell cycle, DNA damage, cellular proliferation, apoptosis, and senescence [Table 1]. The RT-qPCR array was designed exploiting 100-well discs compatible with the Rotor-Gene 6000 instrument [Figure 1], but it could be easily adapted to standard 96-well plates. Most importantly, our array was designed to harbor several technical controls to statistically evaluate final results and to exclude possible experimental bias. Six wells were reserved for no template controls (NTC) to monitor possible contamination (amplifying 3 housekeeping genes GAPDH, RPLP0, and ATP5B-yellow disc section, Figure 1). In addition, one primer pair was designed to amplify part of an intronic region of the GAPDH gene in order to detect possible genomic DNA contaminations resulting from the RNA extraction procedure (purple disc section, Figure 1). The same GAPDH-primer pair was used to amplify commercial genomic DNA as both positive PCR reaction control and internal standard control to compare the efficiency of amplifications performed at different times in different discs (orange disc section, Figure 1).
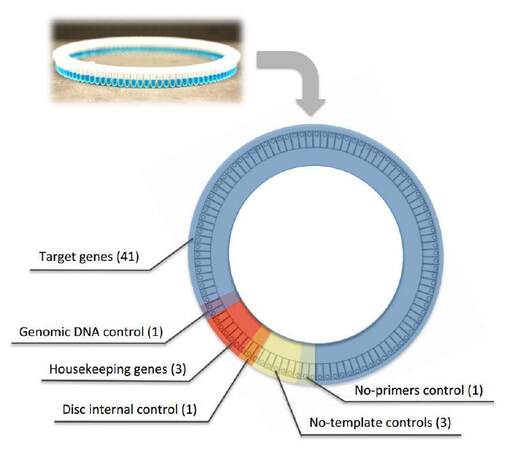
Figure 1. Schematic representation of the RT-qPCR array design. Distribution of the different primer pairs and relative experimental controls using the Rotor Gene 100-wells disc. RT-qPCR: reverse transcription-quantitative polymerase chain reaction
Parameters employed for primers design
| Primer Tm requirements | Min Tm (°C) | 58 |
| Max Tm (°C) | 62 | |
| Optimal Tm (°C) | 60 | |
| Max Tm Difference (°C) | 2 | |
| Primer GC content requirements | Min GC (%) | 40 |
| Max GC (%) | 60 | |
| Primer length requirements | Min length (bp) | 12 |
| Max length (bp) | 40 | |
| Optimal length (bp) | 20 | |
| Amplicon requirements | Min length (bp) | 150 |
| Max length (bp) | 250 |
In order to better control the results, and also to extend the applicability of the assay to different experimental conditions, we designed the RT-qPCR array, including primer pairs able to amplify the 3 stable and housekeeping gene transcripts GAPDH, RPLP0 and ATP5B, to be used as reference for gene expression normalization. All reactions were placed in the 100-well disc in duplicate (red disc section, Figure 1).
Primers were designed following parameters reported in Table 2 in order to optimize and make uniform all PCR reactions of the array. To achieve the best results, we chose primer pairs with the lowest penalty value given by the PrimerExpress 2.0 software.
PCR conditions optimization
In order to optimize the PCR experimental condition, we evaluated: (1) primer efficiency by analyzing the slope of the real-time amplification curves; (2) absence of primer-dimer amplification; (3) specificity of the product; (4) absence of unspecific products by both agarose gel electrophoresis (AGE), and analysis of the melting curve profiles generated after PCR amplification. First, we compared 4 different commercially available master mixes and selected the 1 that, in our conditions, gave the best results in terms of product specificity and amplification efficiency (FastStart SYBR Green Master produced by Roche, Figure 2A-D). Then, we tested different thermal profiles by changing the annealing step temperature (from 56 °C to 66 °C, data not shown), identifying 64 °C as the best annealing temperature. We demonstrated that, at the selected qPCR condition, the slope of the amplification curves was comparable in all array samples [Figure 3A]. In addition, all the different primer pairs generated a unique PCR product as observed through both AGE separation [Figure 3B] and melting curves analysis (data not shown), highlighting the specificity of all the amplifications and the absence of primer-dimer products.
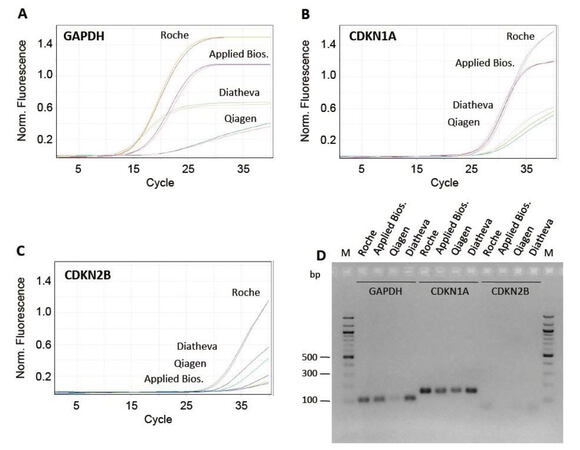
Figure 2. Test of different commercially available master mixes. (A-C) profiles relative to amplification of cDNA using primer pairs for GAPDH, CDKN1A and CDKN2B genes and the following commercially available SYBR-green master mixes: (1) FastStart SYBR Green Master (Roche); (2) SYBR Select Master Mix (Applied Biosystems); (3) RT2 SYBR Green FAST MasterMix (Qiagen); (4) 2X PCR Master Mix (Diatheva). (D) 2% agarose gel electrophoresis of GAPDH, CDKN1A and CDKN2B PCR products. PCR: polymerase chain reaction
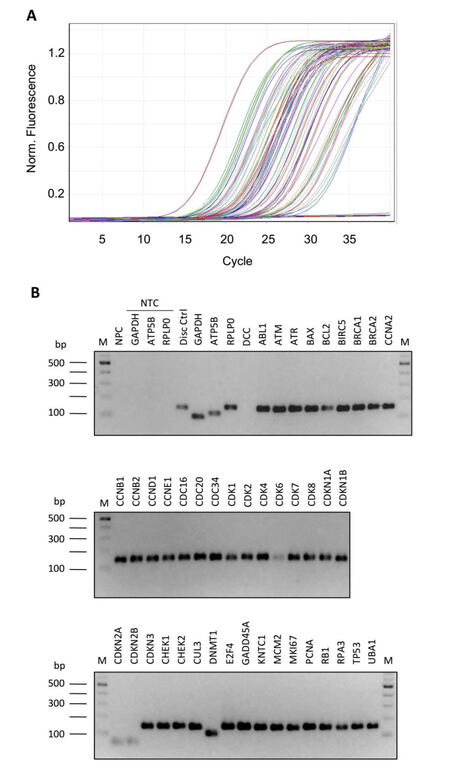
Figure 3. Optimization of PCR conditions. Amplification efficiency and specificity of all gene transcripts of RT-qPCR array. (A) Amplification plot showing profiles slope of different PCR reactions; (B) 2% agarose gel electrophoresis of all array amplicons. PCR: polymerase chain reaction; RT-qPCR: reverse transcription-quantitative polymerase chain reaction; M: 100 bp DNA ladder; NPC: no-primers control; NTC: no-template controls
Modulation of the gene expression profile induced by cisplatin (CDDP)
Once optimized, the RT-qPCR gene array was used to study effects induced by CDDP on HeLa cells. To this end, cells were treated with sublethal doses of CDDP (10 µmol/L for 24 h), obtaining a reduction of cell survival equal to 72.1%.
Total RNA was extracted from treated and untreated HeLa cells and its integrity was evaluated by monitoring the 28S to 18S rRNA ratio through AGE (data not shown). After fluorometric quantitation, 1 µg of RNA was retro-transcribed and the resulting cDNA used for qPCR analysis.
Gene expression profile modulations were evaluated comparing Ct values between treated and non-treated cells, using the 2-∆∆CT method. HeLa cells treated with CDDP showed a clear increase of the abundance of the 2 cell cycle inhibitors CDKN1A (+4.93 fold) and CDKN2B (+7.24 fold), as well as of GADD45A (+23.1 fold, Figure 4A). In addition, other genes playing key functions in both DNA damage response and cell cycle regulation were found to be up-regulated, such as BRCA1 (+2.73 fold) and cyclin dependent kinases 1 and 2 (CDK1, +3.12 fold; CDK2, +2.74 fold), while a significant down-regulation of anti-apoptotic gene BCL2 was observed (-3.63 fold, Figure 4A). Notably, all these regulations were confirmed applying the comparative quantitation method available on Rotor Gene 6000 Series software 1.7 (data not shown). Amplification efficiency was checked by monitoring the slope of amplification curves generated during real-time amplification [Figure 4B and C], while specificity was confirmed by analyzing the uniqueness of the PCR product by melting curve peaks analysis [Figure 4D and E] and AGE (data not shown).
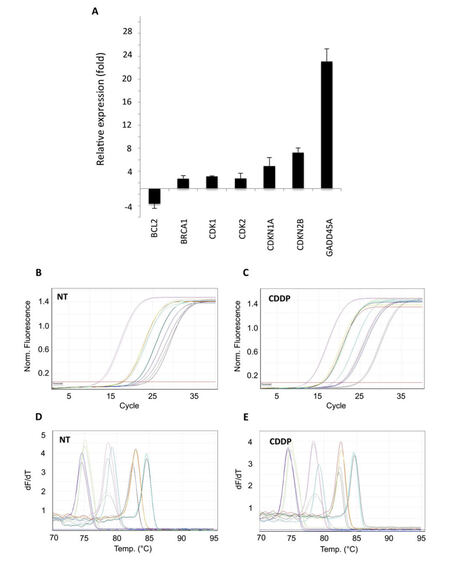
Figure 4. Application of PCR array to cisplatin (CDDP)-treated HeLa cells. Difference in transcriptional activity of cisplatin-treated HeLa cells, compared to non-treated cells, evaluated by 2-∆∆CT method. Data reported as mean ± standard deviation of 3 independent experiments. (A) Relative expression of differentially expressed genes; (B-E) examples of qPCR amplification plots and melting curves of genes found differentially expressed. PCR: polymerase chain reaction
Modulation of gene expression profile induced by sodium butyrate (NaBu)
Subsequently, the RT-qPCR array was used to investigate the effects induced by histone deacetylase inhibitor sodium butyrate (NaBu) on HeLa cells. Even in this case, cells were subjected to sublethal doses of NaBu (5 mmol/L for 16 h) to achieve a reduction of cell survival equal to 68.5%.
Total RNA was extracted from treated and untreated HeLa cells and its integrity evaluated by monitoring 28S to 18S rRNA ratio through AGE (data not shown). After fluorometric quantitation, 1 µg of RNA was retro-transcribed and the resulting cDNA used for qPCR analysis.
As for CCDP treatments, gene expression profile modulations were evaluated comparing Ct values between treated and not treated cells, using the 2-∆∆CT method. NaBu-treated HeLa cells showed down-regulation of cyclins A2 (CCNA2, -2.86 fold), B1 (CCNB1, -2.78 fold), and D1 (CCND1, -9.09 fold), as well as of cyclin-dependent kinase CDK6 (-5.00 fold, Figure 5A). A significant reduction of transcript abundance was monitored also for marker of proliferation MKI67 (-4.76 fold). Moreover, the array showed up-regulation of genes encoding for cyclin-dependent kinase inhibitors CDKN1A (+2.82 fold), CDKN1B (+3.65 fold), and CDKN2B (+3.88 fold), and of GADD45A (+2.72 fold, Figure 5A). Again, all regulations emerged from these analyses were confirmed applying the comparative quantitation method mentioned above (data not shown).
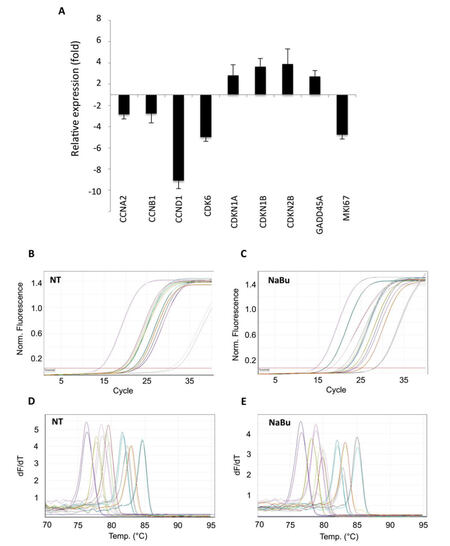
Figure 5. Application of the PCR array to sodium butyrate (NaBu)-treated HeLa cells. Difference in transcriptional activity of sodium butyrate-treated HeLa cells, compared to non-treated cells, evaluated by 2-∆∆CT method. Data reported as mean ± standard deviation of 3 independent experiments. (A) Relative expression of differentially expressed genes; (B-E) examples of qPCR amplification plots and melting curves of differentially expressed genes. PCR: polymerase chain reaction
Analysis of the amplification curves showed that the efficiency of the PCR reaction was similar between the different primer pairs and samples [Figure 5B and C], while the peaks of the melting curves demonstrated the specificity of the PCR product [Figure 5D and E].
Discussion
Here we report the design and validation of a RT-qPCR array that allows the reliable study of gene expression modulations occurring in biological models exposed to drug treatments or to any other different culture condition. In order to better control the results, and also to extend the applicability of the assay to different experimental requirement, we designed a RT-qPCR array to include primers able to amplify 3 different housekeeping genes GAPDH, RPLP0, and ATP5B. The presence of these 3 control genes is extremely important mainly for two reasons: (1) it is unlikely that there exists a “universal” housekeeping gene whose expression can be considered as referee for RNA normalization in any biological model (or treatment) under investigation; (2) despite the control of both the amount and integrity of RNA extracted from different samples, the RT-qPCR could be impaired also by additional experimental variables (e.g. the limit of spectrophotometric analysis, not homogeneous RNA purity).
Furthermore, to monitor possible DNA contamination from the RNA extraction procedure, we also designed a primer pair that amplified an intronic region of the housekeeping gene GAPDH. Importantly, since each sample of cDNA would be amplified in a separated 100-well disc, we also added an additional control to verify the “inter-disc” variability by using, as template, a known amount of human genomic DNA and a primer pair that amplified genomic GAPDH.
To further increase the reliability of the assay, amplification of each target gene was performed in duplicate. Most commercially available PCR arrays contain more target genes but lacks replicates (e.g. 84 genes using the RT2 ProfilerTM PCR arrays by Qiagen, 92 genes using TaqMan Array Plates by Thermo Fisher Scientific, 88 genes using real Time PCR Assay Panels by BioRad), increasing the risk of not identifying possible technical errors.
Prior to using the array in an experimental model, we tested 4 commercially available SYBR Green master mixes, focusing attention on 3 genes that can recapitulate 3 different levels of gene expression: high levels (GAPDH), medium/low levels (CDKN1A), and very low levels (CDKN2B). In fact, it is known that expression level of some genes involved in the DNA-damage response (e.g. genes that are involved in cell cycle regulation, such as CDK-inhibitors) are at the limit of the detection and thus require a highly efficient DNA-polymerase. Therefore, we optimized our RT-qPCR array using SYBR-green master mix that showed the best efficiency in our conditions. This allowed us to monitor transcript levels of low-expressed genes (e.g. CDKN2B) [Figure 2B-D].
Then, the RT-qPCR array was validated using HeLa cells subjected to treatment with two different drugs, CDDP and NaBu, known to induce important modulations of the gene expression profile of this cellular model.
In particular, CDDP treatment was able to up-regulate growth arrest and DNA damage response genes GADD45A and BRCA1, as well as cell cycle inhibitors genes CDKN1A and CDKN2B. These transcriptional elaborations have been widely documented in HeLa cells treated by CDDP.[5,6,17,18] In addition, a significant down-regulation of anti-apoptotic gene BCL2 also confirmed previously reported data.[5,19] All these modulations were largely expected since CDDP is known to exert its activity by targeting DNA of cells and forming covalent adducts that lead to activation of the cellular DNA damage response.[4] In fact, once damaged, cells respond by inhibiting its progression through the cell cycle and, in case of extensive damage, by activating the apoptotic cell death program.
Interestingly, we found that CDDP also induces up-regulation of cyclin dependent kinases 1 and 2 (CDK1 and CDK2). This result, which is to our knowledge the first observation made in HeLa cells, could be put in relation with the known role of these CDKs in apoptosis, in addition to their known functions in regulation of cell cycle progression.[20] This hypothesis is supported by evidence that CDK2 silencing by shRNA decreases cisplatin-induced apoptosis and PARP cleavage in embryonal carcinoma models[21] and opens the door to possible future insights.
Regarding the effects of NaBu, our data confirm the down-regulation of cyclins and CDK6 and the up-regulation of three different CDK inhibitors,[9,10] which reflect the long-known ability of this histone deacetylase inhibitor to regulate the progression of cells through the cell cycle.
Even in this case, the RT-qPCR array allowed us to provide new information about transcriptional activity of the genes under investigation. In fact, NaBu also induced in HeLa down-regulation of the gene encoding for the anti-proliferative antigen MKI67, and up-regulation of GADD45A, a typical sensor of stress involved in growth arrest and in the DNA damage response. These new observations, although already described in other cancer models (MKI67 in prostate cancer[22,23] and GADD45A in colon carcinoma[24]), have never been reported in HeLa cells subjected to NaBu treatment.
In summary, we have designed, optimized, and biologically validated an RT-qPCR array that can be exploited to robustly analyze expression of genes involved in cell cycle regulation, DNA damage response, apoptosis, and senescence induction.
This array represents a reliable, inexpensive, and rapid tool that could be exploited to provide an overview of molecular pathways activated by drug treatment in human cancer cells. Moreover, we believe that detailed description of the procedure will allow application of the RT-qPCR array in different experimental conditions and could contribute to understand the molecular mechanisms of action of new drugs in the context of pharmacologic studies.
Authors’ contributions
Study conception and design: M. Fanelli, S. Amatori
Primers design and PCR conditions optimization: S. Amatori
Validation of the RT-qPCR array: G. Persico
Manuscript writing and editing: M. Fanelli, S. Amatori
Financial support and sponsorship
This work was supported by Associazione a Sostegno degli Studi Oncologici (ASSO), Fano (PU), Italy.
Conflicts of interest
There are no conflicts of interest.
Patient consent
Not applicable.
Ethics approval
Not applicable.
REFERENCES
1. Garman KS, Nevins JR, Potti A. Genomic strategies for personalized cancer therapy. Hum Mol Genet 2007;16 Spec No. 2:R226-32.
2. Rajeevan MS, Ranamukhaarachchi DG, Vernon SD, Unger ER. Use of real-time quantitative PCR to validate the results of cDNA array and differential display PCR technologies. Methods 2001;25:443-51.
3. Bellon SF, Coleman JH, Lippard SJ. DNA unwinding produced by site-specific intrastrand cross-links of the antitumor drug cis-diamminedichloroplatinum(II). Biochemistry 1991;30:8026-35.
4. Siddik ZH. Cisplatin: mode of cytotoxic action and molecular basis of resistance. Oncogene 2003;22:7265-79.
5. Yim EK, Lee KH, Kim CJ, Park JS. Analysis of differential protein expression by cisplatin treatment in cervical carcinoma cells. Int J Gynecol Cancer 2006;16:690-7.
6. Liu Y, Xing H, Han X, Shi X, Liang F, Cheng G, Lu Y, Ma D. Apoptosis of HeLa cells induced by cisplatin and its mechanism. J Huazhong Univ Sci Technolog Med Sci 2008;28:197-9.
7. Shin H, Lee YS, Lee YC. Sodium butyrate-induced DAPK-mediated apoptosis in human gastric cancer cells. Oncol Rep 2012;27:1111-5.
8. Tabuchi Y, Arai Y, kondo T, Takeguchi N, Asano S. Identification of genes responsive to sodium butyrate in colonic epithelial cells. Biochem Biophys Res Commun 2002;293:1287-94.
9. Derjuga A, Richard C, Crosato M, Wright PS, Chalifour L, Valdez J, Barraso A, Crissman HA, Nishioka W, Bradbury EM, Th'ng JP. Expression of p21Waf1/Cip1 and cyclin D1 is increased in butyrate-resistant HeLa cells. J Biol Chem 2001;276:37815-20.
10. Park JK, Cho CH, Ramachandran S, Shin SJ, Kwon SH, Kwon SY, Cha SD. Augmentation of sodium butyrate-induced apoptosis by phosphatidylinositol 3-kinase inhibition in the human cervical cancer cell-line. Cancer Res Treat 2006;38:112-7.
11. Amatori S, Mazzoni L, Alvarez-Suarez JM, Giampieri F, Gasparrini M, Forbes-Hernandez TY, Afrin S, ErricoProvenzano A, Persico G, Mezzetti B, Amici A, Fanelli M, Battino M. Polyphenol-rich strawberry extract (PRSE) shows in vitro and in vivo biological activity against invasive breast cancer cells. Sci Rep 2016;6:30917.
12. Amatori S, Ballarini M, Faversani A, Belloni E, Fusar F, Bosari S, Pelicci PG, Minucci S, Fanelli M. PAT-ChIP coupled with laser microdissection allows the study of chromatin in selected cell populations from paraffin-embedded patient samples. Epigenetics Chromatin 2014;7:18.
13. Guerzoni C, Amatori S, Giorgi L, Manara MC, Landuzzi L, Lollini PL, Tassini A, Balducci M, Manfrini M, Pratelli L, Serra M, Picci P, Magnani M, Fusi V, Fanelli M, Scotlandi K. An aza-macrocycle containing maltolic side-arms (maltonis) as potential drug against human pediatric sarcomas. BMC Cancer 2014;14:137.
14. Rippo MR, Villanova F, TomassoniArdori F, Graciotti L, Amatori S, Manzotti S, Fanelli M, Gigante A, Procopio A. Dexamethasone affects Fas- and serum deprivation-induced cell death of human osteoblastic cells through survivin regulation. Int J Immunopathol Pharmacol 2010;23:1153-65.
15. Andersen CL, Jensen JL, Ørntoft TF. Normalization of real-time quantitative RT-PCR data: a model based variance estimation approach to identify genes suited for normalization, applied to bladder and colon cancer data sets. Cancer Res 2004;64:5245-50.
16. Poloni A, Maurizi G, Mattiucci D, Amatori S, Fogliardi B, Costantini B, Mariani M, Mancini S, Oliviari A, Fanelli M, Leoni P. Overexpression of CDKN2B (p15INK4B) and altered global DNA methylation status in mesenchymal stem cells of high-risk myelodysplastic syndromes. Leukemia 2014;28:2241-4.
17. Butz K, Whitaker N, Denk C, Ullmann A, Geisen C, Hoppe-Seyler F. Induction of the p53-target gene GADD45 in HPV-positive cancer cells. Oncogene 1999;18:2381-6.
18. Sood S, Srinivasan R. Alterations in gene promoter methylation and transcript expression induced by cisplatin in comparison to 5-Azacytidine in HeLa and SiHa cervical cancer cell lines. Mol Cell Biochem 2015;404:181-91.
19. Maldonado V, Melendez-Zajgla J, Ortega A. Modulation of NF-kappa B, and Bcl-2 in apoptosis induced by cisplatin in HeLa cells. Mutat Res 1997;381:67-75.
20. Golsteyn RM. Cdk1 and Cdk2 complexes (cyclin dependent kinases) in apoptosis: a role beyond the cell cycle. Cancer Lett 2005;217:129-38.
21. Koster R, di Pietro A, Timmer-Bosscha H, Gibcus JH, van den Berg A, Suurmeijer AJ, Bischoff R, Gietema JA, de Jong S. Cytoplasmatic p21 expression levels determine cisplatin resistance in human testicular cancer. J Clin Invest 2010;120:3594-605.
22. Kuefer R, Hofer MD, Altug V, Zorn C, Genze F, Kunzi-Rapp K, Hautmann RE, Gschwend JE. Sodium butyrate and tributryn induce in vivo growth inhibition and apoptosis in human prostate cancer. Br J Cancer 2004;90:535-41.
23. Kuefer R, Genze F, Zugmaier W, Hautmann RE, Rinnab L, Gschwend JE, Angelmeier M, Estrada A, Buechele B. Antagonistics effects of sodium butyrate and N-(4-hydroxyphenyl)-retinamide on prostate cancer. Neoplasia 2007;9:246-53.
24. Chen Z, Clark S, Birkeland M, Sung CM, Lago A, Liu R, Kirkpatrick R, Johanson K, Winkler JD, Hu E. Induction and superinduction of growth arrest and DNA damage gene 45 (GADD45) alpha and beta messenger RNAs by histone deacetylase inhibitors trichostatin A (TSA) and butyrate in SW620 human colon carcinoma cells. Cancer Lett 2002;188:127-40.
Cite This Article
Export citation file: BibTeX | RIS
OAE Style
Amatori S, Persico G, Fanelli M. Real-time quantitative PCR array to study drug-induced changes of gene expression in tumor cell lines. J Cancer Metastasis Treat 2017;3:90-9. http://dx.doi.org/10.20517/2394-4722.2017.22
AMA Style
Amatori S, Persico G, Fanelli M. Real-time quantitative PCR array to study drug-induced changes of gene expression in tumor cell lines. Journal of Cancer Metastasis and Treatment. 2017; 3: 90-9. http://dx.doi.org/10.20517/2394-4722.2017.22
Chicago/Turabian Style
Amatori, Stefano, Giuseppe Persico, Mirco Fanelli. 2017. "Real-time quantitative PCR array to study drug-induced changes of gene expression in tumor cell lines" Journal of Cancer Metastasis and Treatment. 3: 90-9. http://dx.doi.org/10.20517/2394-4722.2017.22
ACS Style
Amatori, S.; Persico G.; Fanelli M. Real-time quantitative PCR array to study drug-induced changes of gene expression in tumor cell lines. J. Cancer. Metastasis. Treat. 2017, 3, 90-9. http://dx.doi.org/10.20517/2394-4722.2017.22
About This Article
Copyright

Data & Comments
Data


 Cite This Article 43 clicks

 Like This Article 40
likes
Like This Article 40
likes


Comments
Comments must be written in English. Spam, offensive content, impersonation, and private information will not be permitted. If any comment is reported and identified as inappropriate content by OAE staff, the comment will be removed without notice. If you have any queries or need any help, please contact us at support@oaepublish.com.