
Altered energy metabolism and metabolic gene expression associated with increased metastatic capacity identified in MDA-MB-231 cell line variants


Abstract
Aim: Despite current advances in therapies and the gradual decline in breast cancer-related mortality, metastasis remains a major therapeutic challenge for treatment. Energy reprogramming is now recognized to be an important part of tumorigenic processes, but its relevance in metastatic dissemination has yet to be elucidated.
Methods: Using the MDA-MB-231HM.LNm5 cell line, a novel, highly metastatic variant line derived from TN human breast adenocarcinoma MDA-MB-231 line, alteration in growth and energy metabolisms associated with enhanced metastatic potential were described. Glycolysis and oxidative phosphorylation (OXPHOS) was characterized using the seahorse XF analyzer. Whole transcriptome sequencing (RNA-seq) and quantitative real-time PCR was used to ascertain expression differences in metabolic genes.
Results: We observed reduced proliferation, and an elevation of both glycolytic and OXPHOS metabolism in the highly metastatic daughter line. The elevated metabolic rate is only partially reflected by transcript levels of relevant metabolic regulators. Heightened mitochondrial respiration is potentially underpinned by increased expression mitochondrial electron transport chain components. However, increased glycolysis was not underpinned by up-regulation of metabolic genes encoding enzymes participating in glycolysis.
Conclusion: Our results indicate breast tumour cells with elevated metastatic propensity are more metabolic active. We also identified differentially expressed metabolic genes, such as IDH2, that may play a part in the metastatic process beyond energy reprogramming.
Keywords
Introduction
The majority of breast cancer-related deaths are not caused by the primary tumor itself, but are due to the results of metastasis to vital organs[1]. Although only a small percentage of patients are initially diagnosed with late stage or metastatic breast cancer, the 5-year survival for these patients is 25% compared with 99% for patients diagnosed with localized disease[2]. In addition, current prognostic markers are unable to accurately predict the risk of metastasis development and approximately 30% of patients first diagnosed with earlier-stage breast cancer will eventually develop recurrent metastatic disease[3]. Therefore, despite current advances in therapies and the gradual decline in breast cancer-related mortality[4], the diagnosis and management of metastatic disease remains a major therapeutic challenge for breast cancer treatment.
The dysregulation of cellular energetics is now regarded as one of the hallmarks of cancer[5]. The metabolic phenomenon describing increased glycolytic capacity in cancer cells, known as “the Warburg effect”[6], stimulated decades of research directed towards the characterization of the reprogramming of energy metabolism during cellular transformation and its role in tumor development. The Warburg effect emerged as just one component of global changes in energy metabolism occurring in both cancer cells and the tumor microenviroment[7,8]. Additionally, an increasing number of studies suggest that metabolic reprogramming plays an important role not only in the process of malignant transformation, but also in the growth and survival of tumor cells within a hostile environment, such as the often limited nutrient and oxygen supply in solid tumours[9-11]. However, despite the significant number of studies that investigated the metabolic programming of primary cancer cells, less is known about metabolic alterations in the context of metastatic disease, especially in breast cancer.
Comparison of breast cancer cell lines panel reveals that cell lines with molecular subtypes associated with more aggressive disease progression exhibit an overall increase in energy metabolic processes, including glycolysis and oxidative phosphorylation (OXPHOS)[12-15]. Studies using metastases derived from the same primary tumour reported more puzzling metabolic changes. In a xenograft model using circulating tumor cells from a breast cancer patient, a proteomic comparison between parental cells and cells that metastasized to the brain demonstrated up-regulation in enzymes involved in both glycolysis and mitochondrial respiration pathways[16]. Moreover, compared to primary tumour cells, circulating tumour cells derived from 4T1 mouse mammary tumors exhibited elevated expression of mitochondrial respiration pathway genes, but not glycolytic genes, while lung metastasis from the same primary tumour revealed modest metabolic change[17]. Consistent with this finding, increased OXPHOS, were observed with increased metastatic potential in several metastatic cell line variants derived from the same primary breast cancer[13,18]. These findings provide evidence that energy reprogramming may be an important feature of the complex process of breast cancer metastasis, but also raise the question of whether the metabolic profiles of metastatic cells vary depending on the stage of metastasis and site of distant metastasis.
To gain a better understanding of the metabolic changes underlying the process of breast cancer metastasis, we characterized a highly metastatic variant line of the commonly used triple-negative human breast adenocarcinoma cell line MDA-MB-231[19], and compared cellular and metabolic alterations. The MDA-MB-231HM.LNm5 cell line is a highly angiogenic and metastatic variant of the MDA-MB-231 cell line derived by in vivo passaging whereby spontaneous secondary lesions were isolated and expanded ex vivo[20-23]. We recently demonstrated that the metastatic ability of MDA-MB-231HM.LNm5 line is highly elevated compared to the parental MDA-MB-231 cells. In a metastasis model involving surgical resection of the primary tumour, NSG immune-deficient mice bearing the HM.LNm5 line exhibited primary tumour recurrence, as well as significant lung, liver, spleen, lymph and spine metastasis. By comparison, no metastatic lesions were detected in secondary organs of MDA-MB-231-innoculated mice[23].
In this study, the metabolic profiles of MDA-MB-231HM.LNm5 were compared to the parental MDA-MB-231 cell line using the Extracellular Flux (XF) Analyzer thus enabling simultaneous measurement of the two major cellular energy-producing pathways, glycolysis and OXPHOS. We then used whole transcriptome sequencing (RNA-seq) and quantitative real-time PCR (RT-qPCR) to ascertain expression differences in metabolic genes that were associated with enhanced breast cancer metastatic ability.
Methods
Cell culture
The MDA-MB-231 human breast adenocarcinoma cell line was purchased from ATCC[19]. MDA-MB-231HM cells[20,21] were kindly provided by ZM Shao and ZL Ou (Breast Cancer Institute, Fudan University, Shanghai, China). MDA-MB-231HM.LNm5 cells were derived as described below. All lines were maintained in phenol red - containing RPMI1640 (Invitrogen) supplemented with 10% (v/v) heat-inactivated fetal calf serum (FCS), 2 mmol/L L-glutamine, 1% (v/v) non-essential amino acids, 5% (v/v) sodium pyruvate, 100 U/mL penicillin, 15 mmol/L HEPES buffer, and 0.2% (v/v) sodium bicarbonate (Sigma-Aldrich). Cells were maintained at 37 °C in 5% CO2 and passaged every 4-5 days.
Generation of reporter gene tagged MDA-MB-231 variants
To facilitate optical imaging of tumors in vivo, both parental MDA-MB-231 and MDA-MB-231HM cells were transduced with retrovirus encoding tdTomato fluorescent protein, selected with Blasticidin S and bulk sorted for tdTomato expression by flow cytometry (FACSAria, Beckton Dickinson), as previously described[24]. Both populations were also transduced with retrovirus encoding Firefly luciferase and selected using puromycin[24]. Parental MDA-MB-231 cells were additionally transduced with retrovirus encoding enhanced GFP (encoded by the pFBneoGFP plasmid, a kind gift from Hiroshi Nakagawa, University of Pennsylvania), selected using G418, and bulk sorted for GFP expression using flow cytometry (FACSAria, Beckton Dickinson). MDA-MB-231HM.LNm5 cells were isolated from a spontaneous axillary lymph node metastasis that developed from a reporter gene tagged MDA-MB-231HM primary inguinal mammary tumour in a BALB/c-SCID mouse.
Cellular proliferation
Cells seeded at 105 cells/cm2 into 24-well plastic plates were allowed to adhere overnight and were then rendered quiescent by incubation in serum-free medium containing 0.25% (v/v) bovine serum albumin for 24 h before re-exposing to FCS (5%, 10%) for 48 h. Viable cells were identified by the trypan blue (0.06% w/v) exclusion[25] and enumerated (blinded) manually using a haemocytometer chamber.
Cellular proliferation using Resazurin (Alamar Blue)
Cell proliferation was also assessed using the Resazurin dye method by measuring reduction of the redox dye resazurin to resorufin[26]. Cells were seeded and treated as described in previous section, and were then incubated with Resazurin reagent containing 1.5% (w/v) Resazurin, 0.25 (w/v) methylene blue, 2.9% (w/v) potassium hexacyanoferrate (III) and 4.22% (w/v) potassium hexacyanoferrate (II) trihydrate for 2 h at 37 °C in 5% CO2. Resorufin formation was measured fluorometrically (excitation 570 nm; emission 620 nm) using a FlexStationII (Molecular Devices, Sunnyvale, CA, USA). Results are expressed in relative fluorescent units.
Extracellular flux assay
The extracellular acidification rate (ECAR)and oxygen consumption rate (OCR) were measured in real-time using the XF24 extracellular flux bioanalyzer (Seahorse Bioscience, Agilent Technologies Australia, Mulgrave, Vic, Australia), as described previously[27]. Briefly, MDA-MB-231 or MDA-MB-231HM.LNm5 cells were seeded at a concentration of 100,000 cells/well in RPMI medium the day before the assay. One hour before the start of the metabolic profiling assay the medium was changed to XF Base medium (Seahorse Bioscience) supplemented with sodium pyruvate (1 mmol/L), D-glucose (25 mmol/L) and adjusted to pH7.4. To determine glycolytic parameters, ECAR was measured at baseline and after injection of oligomycin (5 μmol/L) [Supplementary Figure 1A]. To determine respiration parameters, OCR was measured at baseline and after injection of Oligomycin (5 μmol/L), [carbonyl cyanide-4 (trifluoromethoxy) phenylhydrazone (FCCP), 1 μmol/L] and a combination of antimycin A and rotenone (2.5 μmol/L each). Parameters of mitochondrial respiration were measured according to the XF cell Mito Stress test user manual [Supplementary Figure 2A].
RT-qPCR
RNA samples were isolated from 3 or more independent experiments. Total RNA was isolated using TRIzol® reagent (Life technologies). RNA (100 ng) was reverse-transcribed using the High Capacity cDNA Reverse Transcription Kit (Invitrogen, Mulgrave, Vic, Australia). Reactions of 5 µL total volume were performed using a Mastercycler® Pro (Eppendorf, Hamburg, Germany). cDNA (1 ng) was used for real-time PCR using iTaq™ universal SYBR® Green Supermix (Bio-Rad, Gladesville, NSW, Australia) and an ABI Prism 7900HT sequence detection system (Applied Biosystems), as described previously[22]. Gene expression was normalized to 18S ribosomal RNA using the 2-ΔCt method[28]. Specificity of the primer sets was confirmed by dissociation curve analysis. Primer sequences are listed in Supplementary Table 1.
RNA-seq library preparation and sequencing
RNA was pooled from 9 individual cultures of independent culture passage of MDA-MB-231HM.LNm5 cell line and the parental MDA-MB-231 cell line. Total RNA was isolated using TRIzol® (as above). RNA-seq libraries were constructed from 500 ng total RNA using NEBNext Ultra RNA library prep kit for Illumina (#E7530) with NEBNext Poly(A)mRNA Magnetic Isolation Module (#E7490). Prior to library preparation, RNA was confirmed to be of high quality (RNA integrity number > 8) by Agilent Bioanalyzer 2100 analysis. Paired end 2 × 50 bp rapid sequencing was performed on an Illumina HiSeq 2500 (Melbourne Translational Genomic Platform, University of Melbourne). Raw data was filtered by removing reads with adaptor sequences, reads where the percentage of unknown bases is greater than 10%, and reads considered to be of low quality (where bases with quality ≤ 5 constitute greater than 50% of base reads) to obtain “clean reads”. All subsequent analyses are based on “clean reads” only.
RNA-Seq data analysis
FASTQ files were first analysed using FASTQC software (http://www.bioinformatics.babraham.ac.uk/projects/download.html) before proceeding with an integrated sequence trimming and alignment step against the UCSC hg19 human reference genome downloaded from Illumina’s iGenomes (https://support.illumina.com/sequencing/sequencing_software/igenome.html) using Rsubread package (v 1.20)[29]. Reads that were aligned to annotated coding regions of the genome were counted using the “featureCounts” feature from Rsubread[30]. These counts were subsequently normalized using the trimmed mean of M-value method[31] and transformed into counts per million (CPM) to describe gene expression level. As a single replicate per condition was used, we assigned a biological coefficient of variation of 0.3 to proceed with the pairwise comparison analyses for the detection of differentially expressed genes using EdgeR software[32].
Gene ontology analysis and gene list extraction
A list of all 1,158 nuclear-encoded mitochondrial genes was obtained from the MitoCarta2.0 human inventory[33]. Genes associated with the processes of glycolysis (canonical glycolysis GO:0061621; glycolytic process GO:0006096; positive regulation of glycolytic process GO:0045821; negative regulation of glycolytic process GO:0045820; regulation of glycolytic process GO:0006110) and tricarboxylic acid (TCA) cycle (GO:0006099) were extracted from the gene ontology consortium website using the AmiGO Gene Ontology browser (http://amigo.geneontology.org/amigo)[34]. Genes contained within the mitochondrial respiratory chain complexes [The Hugo Gene Nomenclature Committee (HGNC) family ID: 639; Complex I GO:006120; complex II GO006121; complex III GO:006122; complex IV GO:006123; complex V GO:006124] as well as mitochondrial respiratory chain complex assembly factors (HGNC family ID:645) were extracted from HGNC data base (http://www.genenames.org) under the “gene family” browser[35]. Genes with CPM < 1 were excluded from analysis.
Statistical analyses
All statistical analyses were conducted using Prism v6.0 software (Graph Pad, San Diego, CA, USA). Results are expressed at mean ± SEM from n independent experiments (performed on separate days on cells from a different passage) and analysed as grouped data. Cell proliferation data are expressed as a percentage of unstimulated control cell number. Two-way ANOVA with repeated measures with Bonferroni’s post hoc test was performed to ascertain statistical significance. For XF analyser profiles and qRT-PCR analysis, significance was determined by paired two-tailed Student’s t-test. P < 0.05 was considered a significantly difference for all analyses.
Results
The MDA-MB-231HM.LNm5 cell line shows slower serum-induced proliferation in vitro than the parental MDA-MB-231 cell line
MDA-MB-231HM.LNm5 cells exhibit lower migratory and invasive capabilities compared to the parental MDA-MB-231 cells, despite enhanced metastatic potential[22]. Here we see decreased MDA-MB-231HM.LNm5 cell proliferation compared to the parental cells, as measured by either cell enumeration or resazurin dye reduction. FCS (5% or 10%) increased the number of both parental MDA-MB-231 and MDA-MB-231HM.LNm5 cells [Figure 1A]. However, the number of cells resulting from 48 h of proliferation was significantly reduced in MDA-MB-231HM.LNm5 cells compared to parental cells [Figure 1A]. The commonly used Resazurin “proliferation” assay demonstrated a similar percentage increase in MDA-MB-231 cell number at 5% and 10% FCS [Figure 1B], whereas the FCS response of MDA-MB-231HM.LNm5 cell was barely detectable. The differences in the outcomes of experiments using the two different methodologies not only illustrate the limitation of Resazurin use for assessment of cell proliferation, but also emphasize that the indirect measurement of cell number using metabolically converted substrates without independent verification is prone to generate incorrect conclusions.
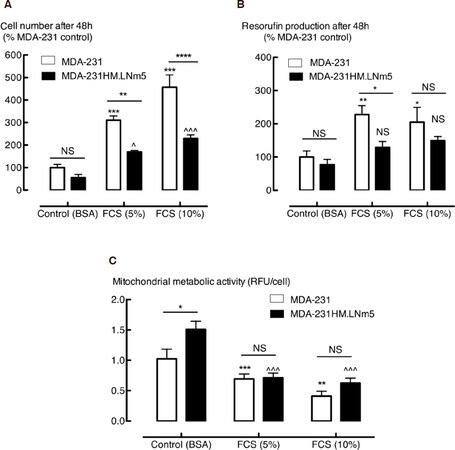
Figure 1. Proliferation of the highly metastatic MDA-MB-231HM.LNm5 (MDA-231HM.LNm5) and parental MDA-MB-231_ATCC (MDA-231) cell lines. Cell growth in the presence and absence of fetal calf serum (FCS) (5% or 10%) after 24 h serum starvation was measured by enumeration of viable cells (tryplan blue exclusion) (A) or the resazurin fluorometric method (B). Mitochondrial metabolic activity (C) was also determined [total relative fluorescent units (RFU) divided by the total number of cells]. Data is presented as mean ± SEM, n = 4. Two-way ANOVA with Bonferroni’s post hoc test was used to test for statistical significance *P < 0.05; **P < 0.01; ***P < 0.001 vs. MDA-231 control; ^P < 0.05; ^^^P < 0.001 vs. MDA-231HM.LNm5 control. BSA: bovine serum albumin; NS: not significant
The metastatic line MDA-MB-231HM.LNm5 is more metabolically active than the parental MDA-MB-231 cells line
Although the conversion of resazurin to resorufin is widely used as a “proliferation” assay, an estimate of mitochondrial metabolic activity could be extracted by calculating resorufin production per cell, as resazurin undergoes enzymatic reduction in the mitochondria to generate the fluorescent resorufin product[36]. Unstimulated MDA-MB-231HM.LNm5 cells have significantly higher basal mitochondrial activity compared to the parental cells, a difference that was not observed in the presence of serum [Figure 1C]. However, as both cytosolic and microsomal enzymes have the ability to reduce resazurin[37], we sought a more precise method for quantification of the metabolic changes potentially associated with enhanced metastatic phenotype.
The XF bioanalyser facilitates real time measurement of the two major energy-producing pathways in the cell, namely glycolysis and OXPHOS. The ECAR, is a measure of glycolysis, and is determined by the net production and extrusion of protons into the culture medium as a result of the conversion of glucose to pyruvate and subsequently to lactate plus H+. Simultaneously, OXPHOS is measured by calculating the OCR.
Measurement of OCR and ECAR baseline conditions in the absence of glutamine and lipids showed a near doubling of OXPHOS (OCR) and an approximately 25% increase in glycolysis (ECAR) in the MDA-MB-231HM.LNm5 cells compared to the parental MDA-MB-231 cells [Figure 2A]. Both cell lines were challenged to their maximum glycolytic and respiratory capacity by treatment with oligomycin and FCCP, respectively. Oligomycin inhibits ATP production by inhibiting the mitochondrial ATP synthase (complex 5). This subsequently triggers any cellular energy production that was occurring by respiration to shift to glycolysis, thus revealing the maximum glycolytic rate [Supplementary Figure 1A]. FCCP, on the other hand, is an uncoupling agent that disrupts the mitochondrial membrane potential and stimulates the respiratory chain to operate at maximum capacity [Supplementary Figure 2A]. Compared to the parental MDA-MB-231 cell line, MDA-MB-231HM.LNm5 cells showed higher maximum glycolytic and marginally higher respiratory capacity [Figure 2B].
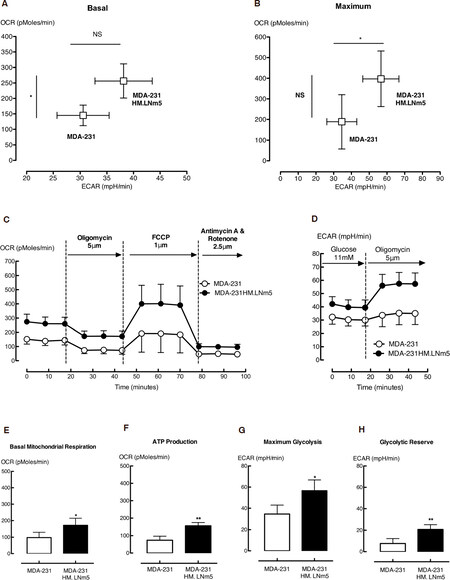
Figure 2. The metabolic phenotype of the highly metastatic MDA-MB-231HM.LNm5 (MDA-231HM.LNm5) and parental MDA-MB-231 (MDA-231) cell lines. Baseline oxygen consumption rate (OCR) and extracellular acidification rate (ECAR) calculated in the presence of glucose were combined to generate the basal phenogram (A), while maximum ECAR (Oligomycin treated) and maximum OCR [carbonyl cyanide-4 (trifluoromethoxy) phenylhydrazone (FCCP) treated] were combined to generate the maximum phenogram (B). The glycolytic profile shows ECAR readings in the presence of glucose (11 mmol/L) from which the basal glycolytic rate was calculated (C) [Supplementary Figure 1]. Following injection of oligomycin (5 μmol/L), both maximum glycolytic rate (G) and glycolytic reserve (H) could be determined. The respiration profiles of both cell lines (D) show OCR readings in the presence of glucose and following subsequent addition of oligomycin (5 μmol/L), FCCP (1 μmol/L) and finally antimycin plus rotenone (2.5 μmol/L of each). This procedure allows the quantification of basal mitochondrial respiration (E) and ATP production (F), as well as maximal mitochondrial respiration, spare respiration capacity, proton leak and non-mitochondrial respiration [Supplementary Figure 2]. Data are presented as mean ± SEM, n = 5-7. The student’s t-test was used to test for statistical significance. NS: not significant; *P < 0.05, **P < 0.01
To ensure that the metabolic alteration observed was independent of the exogenous fluorescent proteins and luciferase in the cells the assay was repeated in reporter gene-free MDA-MB-231 and MDA-MB-231HM.LNm5 lines. Basal OCR and ECAR were increased in the MDA-MB-231HM.LNm5 lines compared to the parent, albeit the differences were less striking. Maximum OCR was also higher in the MDA-MB-231HM.LNm5 lines, while maximum ECAR remained similar [Supplementary Figure 3].
MDA-MB-231HM.LNm5 cells display enhanced glycolytic reserve, mitochondrial respiration and ATP synthesis
The increase in ECAR in the presence of oligomycin not only demonstrates the maximum glycolytic rate, but also shows the glycolytic reserve [Supplementary Figure 1A]. MDA-MB-231HM.LNm5 cells showed a larger increase in ECAR compared to the MDA-MB-231 parental line following oligomycin treatment [Figure 2D], revealing higher maximum glycolytic rates and reserves [Figure 2G and H]. Similarly, the difference between maximum OCR and basal OCR allows calculation of the spare respiratory capacity, which did not differ between the two cell lines [Supplementary Figure 2B].
Both mitochondrial and non-mitochondrial respiration contributed to the basal and maximum OCR. The combination of rotenone, a complex I inhibitor, and antimycin A, a complex Ill inhibitor, shut down mitochondrial respiration completely, leaving respiration driven by processes outside the mitochondria only. MDA-MB-231HM.LNm5 cells showed significantly higher mitochondrial-dependent basal respiration [Figure 2E] and similar mitochondrial and non-mitachondrial -dependent maximum respiration rates compared to the parental cells [Supplementary Figure 2C and D].
The two processes that control basal mitochondrial respiration, ATP production and proton leak, can be probed with the blockade of ATP synthase using oligomycin. Measuring the reduction in OCR upon addition of oligomycin revealed significantly higher mitochondrial ATP synthesis in MDA-MB-231HM.LNm5 cells compared to parental MDA-MB-231 cells [Figure 2F], but unchanged proton leak-driven respiration [Supplementary Figure 2E].
Gene expression analysis of energy metabolism pathways
In order to associate the observed metabolic changes with specific genetic or epigenetic alterations, we first selected several genes encoding enzymes that participate in glycolysis and the TCA cycle that were documented to contribute to altered metabolism in cancer cells[38]. RT-qPCR analysis of glucose transporter type 1 [solute carrier family 2 member 1 (SLC2A1)], hexokinase 2, fructose-2,6-biphosphatase 3, muscle pyruvate kinase 2, pyruvate dehydrogenase kinase 1, cytosolic isocitrate dehydrogenase-1 (IDH1), succinate dehydrogenase complex subunits C and D and fumarate hydratase mRNA showed similar expression levels between the MDA-MB-231HM.LNm5 cells and parental cells [Figure 3].
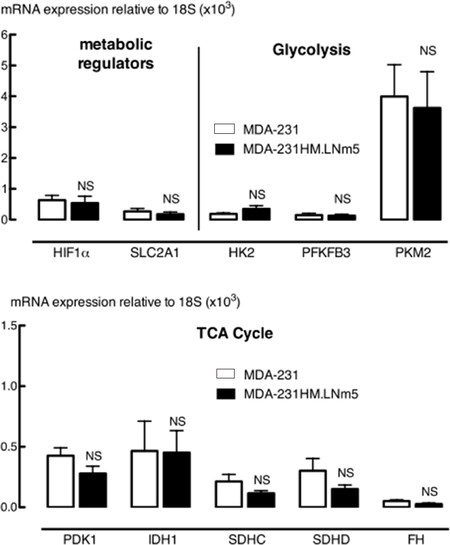
Figure 3. qRT-PCR analysis of metabolic regulatory genes, glycolysis and tricarboxylic acid (TCA) cycle genes in MDA-MB-231HM.LNm5 (MDA-231HM.LNm5) and parental MDA-MB-231 (MDA-231) cell lines. Expression of hypoxia inducible factor 1 alpha subunit (HIF1a), solute carrier family 2 member 1 (SLC2A1)/GLUT1, hexokinase 2 (HK2), fructose-2,6-biphosphatase 3 (PFKFB3), pyruvate kinase, muscle (PKM2), pyruvate dehydrogenase kinase 1 (PDK1), cytosolic isocitrate dehydrogenase-1 (IDH1), succinate dehydrogenase complex subunits C and D (SDHC, SDHD), and fumarate hydratase (FH) were measured by SYBR-green qRT-PCR relative to 18S rRNA levels. Results are presented as mean ± SEM, n = 7-8. The student’s t-test was used to test for statistical significance. Not significant (NS), compared to MDA-MB-231 cells
To produce an unbiased analysis, the whole transcriptome of each cell line was then deep-sequenced using RNAseq, and the expression of genes involved in key pathways of energy metabolism was compared, including those influencing glycolysis and mitochondrial respiration. Gene expression level was expressed as CPM and the expression level of gene sets was compared by calculating the ratio between two cell lines using the MDA-MB-231 parental line as the denominator. Transcript per million was also compared and yields similar ratio (data not shown). The comparison of all mitochondrial genes showed a symmetrical distribution of expression around a log-fold change of 0, indicating no predominant direction of effect, although some genes were dysregulated between the two cell lines [Figure 4A]. Genes encoding enzymes directly involved in glycolysis were expressed at lower levels in MDA-MB-231HM.LNm5 cells compared to the parental cells [Figure 4B, Supplementary Table 2]. In particular, hexokinase domain containing 1 (HKDC1), encoding the hexokinase isoform HKDC1 which catalyzes the rate-limiting and obligatory first step of glucose metabolism[39], was significantly down-regulated (Table 1 log2FC = -6.64). However, the majority of genes involved in regulating glycolytic processes showed unaltered expression between the two cell lines. The most differentially expressed genes were those that were down-regulated in metastatic cells [Figure 4B, Table 1, Supplementary Table 3], including MLX interacting protein-like (MLXIPL, log2FC = -6.73), encoding a leucine zipper transcription factor of the Myc/Max/Mad superfamily, and FBP1 (log2FC = -5.36), encoding the gluconeogenesis regulatory enzyme fructose-1,6-bisphosphatase-1. Reduced expression of these genes in MDA-MB-231HM.LNm5 was confirmed by RT-qPCR [Figure 5].
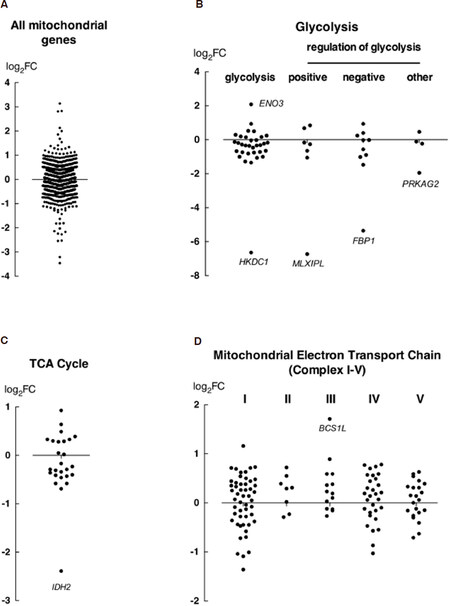
Figure 4. RNA-seq analysis of metabolic gene expression alteration between the MDA-MB-231HM.LNm5 and parental MDA-MB-231 cell lines. Expression level of all mitochondrial genes (MitoCarta 2.0) were compared (A), as well as genes involved in key processes of energy metabolism, including glycolysis (B) (glycolytic process: GO: 0061621 & 0006096; positive regulator of glycolytic process: GO: 0045821; negative regulator of glycolytic process: GO: 0045820; regulation of glycolytic process: GO: 0006110), tricarboxylic acid (TCA) cycle (C) (GO: 0006099), and the electron transport chain (D) (mitochondrial respiratory chain complexes: HGNC family ID: 639 & mitochondrial respiratory chain complex assembly factors HGNC family ID: 645). The log2FC (y-axis) is derived from counts per million (CPM) values for MDA-MB-231HM.LNm5 divided by CPM values for MDA-MB-231, where a positive FC value represents up-regulation in the MDA-MB-231HM.LNm5 cells and a negative value represents down-regulation. Genes with a CPM value of < 1 across both samples were not included. FC: fold change; ENO3: enolase 3; HKDC1: hexokinase domain containing 1; MLXIPL: MLX interacting protein-like; FBP1: fructose-1,6-bisphosphatase-1; PRKAG2: protein kinase, AMP-activated, gamma 2 non-catalytic subunit; IDH2: isocitrate dehydrogenase-2; BCS1L: ubiquinol-cytochrome C reductase complex III chaperone
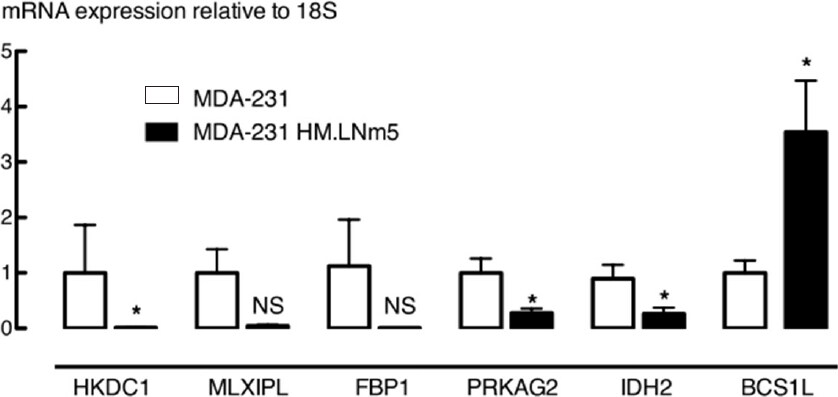
Figure 5. qRT-PCR analysis of candidate differentially expressed metabolic genes between MDA-MB-231HM.LNm5 (MDA-231HM.LNm5) and parental MDA-MB-231 (MDA-231) cell lines. Results are presented as mean ± SEM, n = 9. Expression in MDA-231 was set to 1. The student’s t-test was used to test for statistical significance. NS: not significant; *P < 0.05 compared to MDA-MB-231 parental cells
Differentially expressed metabolic genes in MDA-MB-231HM.LNm5 (MDA-231HM.LNm5) and parental MDA-MB-231 (MDA-231) cell lines, as detected by RNA-seq
| Metabolic process | Gene symbol | Gene name | Entrez gene ID | CPM | Log2FC | |
|---|---|---|---|---|---|---|
| MDA-231 | MDA-231 HM.LNm5 | |||||
| Canonical glycolysis (GO:0061621); glycolytic process (GO: 0006096) | ENO3 | Enolase 3 (beta, muscle) | 2027 | 12.8 | 31.9 | 2.08 |
| BPGM | 2,3-bisphosphoglycerate mutase | 669 | 18.5 | 9.5 | -1.01 | |
| ENO2 | Enolase 2 (gamma, neuronal) | 2026 | 204.2 | 115.1 | -1.01 | |
| PGK1 | Phosphoglycerate kinase 1 | 5230 | 804.8 | 408.4 | -1.07 | |
| PFKL | Phosphofructokinase, liver | 5211 | 255.6 | 117.1 | -1.29 | |
| PPP2R5D | Protein phosphatase 2, regulatory subunit B’, delta | 5528 | 214.5 | 88.7 | -1.35 | |
| HKDC1 | Hexokinase domain containing 1 | 80201 | 19.5 | 3.2 | -6.64 | |
| Positive regulator of glycolytic process (GO: 0045821) | INSR | Insulin receptor | 3643 | 65.5 | 34.9 | -1.06 |
| MLXIPL | MLX interacting protein-like | 51085 | 3.8 | 0.5 | -6.73 | |
| Negative regulator of glycolytic process (GO: 0045820) | PPARA | Peroxisome proliferator-activated receptor alpha | 5465 | 45.3 | 17.7 | -1.02 |
| IER3 | Immediate early response 3 | 8870 | 590.1 | 278.6 | -1.48 | |
| FBP1 | Fructose-1,6-bisphosphatase 1 | 2203 | 29.1 | 2.4 | -5.36 | |
| Regulation of glycolytic process (GO: 0006110) | PRKAG2 | Protein kinase, AMP-activated, gamma 2 non-catalytic subunit | 51422 | 71.4 | 32.7 | -1.95 |
| Tricarboxylic acid cycle (TCA) (GO:0006099) | IDH2 | Isocitrate dehydrogenase 2 (NADP+), mitochondrial | 3418 | 30.7 | 6.5 | -2.39 |
| Mitochondrial Complex I (GO:006120) (HGNC family ID: 640, 645) | NDUFAF5 | NADH dehydrogenase (ubiquinone) complex I, assembly factor 5 | 79133 | 10.1 | 18.0 | 1.16 |
| NDUFB11 | NADH dehydrogenase (ubiquinone) 1 beta subcomplex, 11, 17.3 kDa | 54539 | 44.0 | 26.2 | -1.01 | |
| NDUFB2 | NADH dehydrogenase (ubiquinone) 1 beta subcomplex, 2, 8 kDa | 4708 | 73.4 | 36.7 | -1.04 | |
| NDUFV3 | NADH dehydrogenase (ubiquinone) flavoprotein 3, 10 kDa | 4731 | 37.8 | 19.9 | -1.09 | |
| NDUFV2 | NADH dehydrogenase (ubiquinone) flavoprotein 2, 24 kDa | 4729 | 18.2 | 11.1 | -1.36 | |
| Mitochondrial Complex III (GO:0006122) (HGNC family ID: 642, 645) | BCS1L | BC1 (ubiquinol-cytochrome c reductase) synthesis-like | 617 | 23.3 | 55.2 | 1.71 |
| Mitochondrial Complex IV (GO:0006123) (HGNC family ID: 643, 645) | COA6 | Cytochrome c oxidase assembly factor 6 | 388753 | 16.8 | 9.2 | -1.03 |
Expression of TCA cycle genes was similar between two cell lines with the exception of IDH2 (mitochondrial isocitrate dehydrogenase), which was expressed at one-fifth the levels of the parental MDA-MB-231 cells (Figure 4C, log2FC = -2.39, Supplementary Table 4). This down-regulation was confirmed by RT-qPCR [Figure 5].
The electron transport chain (ETC) in mitochondria is a key site for oxidative phosphorylation and is the major energy source used to produce ATP. The aforementioned XF mitochondrial stress test quantitatively probes this process. Expression levels of all five complexes were higher in metastatic daughter line compared to parental line, while genes belonging to complex II and III showed the greatest up-regulation. The expression of ubiquinol-cytochrome C reductase complex III chaperone (BCS1L), encoding a ubiquinol-cytochrome C reductase complex III chaperone, was the most strikingly elevated of all the ETC genes (Figure 4D, log2FC = 1.71, Supplementary Table 5).
Discussion
MDA-MB-231 human breast cancer cells, originally derived from the pleural effusion of a patient with metastatic dissemination[19], exhibit a gene expression signature predicting poor-prognosis[40]. Although this line has been used to study breast cancer metastasis, and despite deriving from tumors with metastatic capability in the original patient, the MDA-MB-231 cell line often displays poor spontaneous metastatic ability when used in immuno-compromised mice, including BALB/c nude and NOD.SCID strains[41]. The MDA-MB-231HM.LNm5 cell line, on the other hand, provides a much better model for the study of breast cancer metastasis in vivo. Compared to the parental MDA-MB-231 cells, this lymph node metastasis-derived sub-line not only shows aggressive spontaneous metastasis, but also mimics the organ tropism of metastatic human breast cancer, with spontaneous metastasis to lung, liver, spleen and sentinel lymph node[22,23].
Real time bioenergetics assessment revealed an elevated glycolytic rate and oxidative phosphorylation in MDA-MB-231HM.LNm5 cells compared to the parental line, suggesting that the more metastatic line offers greater energy plasticity. This increased metabolic capacity reflects a composite of both energy demands for energy production used in macromolecule biosynthesis and metabolism and could be a result of an increased energy requirement accompanying the acquisition of metastatic potential. Interestingly, we showed that this enhanced metastatic ability was associated with reduced in vitro migratory and proliferative phenotype[22,23].
Enhanced proliferative rate has long been considered as a hallmark of tumor cells, which is the basis for conventional chemotherapy[5]. Early molecular profiling studies of human breast tumors revealed that increases in proliferative gene signatures (for example genes directly associated with cell cycle progression) were associated with worse clinical outcome[42,43]. However, evidence also shows migratory, and thus invasive phenotype and proliferative phenotype are not expressed simultaneously in breast cancer. Indeed, breast cancer subpopulations with elevated metastatic activity are not more proliferative than their parental population[44]. Recent finding revealed MDA-MB-468 cells with reduced E-cadherin (inducing EMT) were more migratory, invasive and less proliferative[45]. Others showed positive correlation between bone marrow metastasis and the levels of circulating but non-proliferating breast cancer cells[46]. Furthermore, the correlation between breast cancer cell lines extracted from tumours of various disease stages and their growth rate indicate that proliferation decreases with disease progression[47]. These observations, together with our own, support the phenomenon known as the “migration/proliferation dichotomy”[48] or a “go or grow” mechanism[49], where cell motion and proliferation appear to be mutually exclusive phenotypes.
The inverse relationship observed between cell proliferation and metastatic ability may be explained by the cancer stem cells theory, where quiescent/slowly dividing cells exhibit increased tumorigenic potential[50-52]. In addition to slow growth rate, these quiescent stem cells are also relatively resistant to current chemotherapy and radiotherapy treatments[53], show increased metastatic ability through the epithelial-to-mesenchymal transition[54] and potentially explain the inter-tumoural heterogeneity and therapeutic failure seen in metastatic breast cancer[55].
Speculation can be made on other biological capabilities requiring higher cellular energy that contribute to increased metastatic potential, including the ability to resist cell death (especially in the circulation), induce angiogenesis, and evade immune destruction[5]. Emerging evidence suggests that some key cellular energetics regulators and processes can also be linked to the induction of angiogenesis[56], the triggering of cancer cell death[57], and shaping the immune micro-environment in the tumor stroma[58]. However, the nature of the relationship between these biological processes and cancer metabolism phenotype has been largely unexplored and warrants further study.
Our results show that the increased glycolysis in the MDA-MB-231HM.LNm5 cells was not underpinned by up-regulation of metabolic genes encoding enzymes participating in glycolysis. On the contrary, glycolytic genes were expressed at a comparatively lower level in the metastatic daughter line. Interestingly, reductions in HKDC1 and MLXIPL expression have been reported to be associated with reduced glucose uptake[59,60], although we did not observe any change in expression levels of any of the major glucose transporters such as GLUT1 (SLC2A1). Protein post-translational modification (PTM) is a key mechanism of regulation in signal transduction pathways. Studies have shown that up-regulated glycolysis can be influenced through diverse PTMs including phosphorylation, acetylation, glycosylation and oxidation of glycolytic enzymes as well as other signaling mediators (reviewed[61]). It is not unlikely that the observed elevation of glycolytic activity in the metastatic cells was the result of PTMs and gene expression were lowered as compensating mechanism. Further studies would need to be carried out to investigate whether proteomic changes are correlated with transcriptomic observations.
The XF mitochondrial stress test revealed that the elevated oxidative phosphorylation observed in the metastatic cells is independent of leaky mitochondria and is mainly explained by the enhanced production of ATP. The result further suggests a higher energy demand in the metastatic MDA-MB-231HM.LNm5 line compared to the parental line. Additionally, we found increased expression of all five complexes of the mitochondrial electron transport chain, which are the mediators of oxidative phosphorylation. Although this elevation was modest in magnitude, it may be sufficient to shift the entire metabolic profile of the cells.
In addition to the XF analyzer, metabolic status could also be measured by a variety of assays such as direct measurements of various metabolic enzymes, substrates, or ATP as surrogates of total energy metabolism. Although these metabolic assays each have their limitations and are mostly single-point measurements, it would have added valuable verification of our XF observation.
IDH2 expression was significantly reduced in MDA-MB-231HM.LNm5 cells while IDH1 levels remain unchanged. Interest in this family of enzymes in relation to cancer biology arose from reports of recurring mutations in IDH1 and IDH2 genes in several cancers including colorectal cancer and gliomas[62]. The functionality of these mutants and their impact on cancer progression has been the focus of many studies. Currently, inhibitors of mutant IDH1 and IDH2 are in Phase I/II clinical trials for both solid and myeloid tumors. In breast cancer, IDH gene mutations are detected at a frequency of less than 5%[63]. Compared to the substantial focus on mutant forms of IDH, little is known about the role of wild-type IDH1, and even less of wild-type IDH2, in cancer progression and metastasis. Hepatocellular carcinoma patients with reduced levels of IDH2 in tumors were at increased risk of metastatic progression and showed worse prognosis[64]. Similarly, in osteosarcoma, IDH2 levels were inversely correlated with pathological grade and metastasis[65]. The suggestion from these correlative observations, that wild-type IDH2 suppresses metastatic processes, is further supported by our data. In addition, our findings suggest that the mechanism by which IDH2 may inhibit metastasis is independent of cellular energy pathways.
Our transcriptomic findings warrant further studies that directly investigate the role of the abovementioned DEGs in metastatic behaviors of breast cancer cells. Knockdown and/or ectopic overexpression of genes of interest found in our study, such as BCS1L or IDH2, in the metastatic MDA-MB-231HN.LNm5 and/or non-metastatic MDA-MB-231 cells may reveal the relationship between these genes and metastatic phenotypes including metabolic reprogramming. Moreover, related animal experiments involving the manipulation of the expression of these genes of interest would further characterize their contribution in breast cancer growth and progression.
We acknowledge the limitation of having carried out the metabolic and transcriptomic studies in cultured cells. The clinical relevance of human cell line models has been questioned. Indeed, there is not always a linear correlation between in vitro proliferation or motility and spontaneous metastatic capacity in vivo, as other cellular phenotypes, influencing intravasation, extravasation and survival in the circulation (among others) also play a role. However, to determine precise ECAR and OCR measurement in vivo would be technically challenging. Future studies involving metabolic and transcriptomics analysis of tumour cells isolated in situ are required.
In conclusion, until recently, metabolic reprogramming in the context of metastatic dissemination has been largely unexplored in breast cancer. In the present study, a model of spontaneous metastatic breast cancer was used to identify metabolic alterations involved in breast cancer progression. The highly metastatic MDA-MB-231HM.LNm5 line displayed higher glycolytic activity and elevated oxidative phosphorylation compared to the parental MDA-MB-231 line, despite reduced proliferative ability. We also showed that this enhanced metabolic rate is only partially reflected by transcript levels of relevant metabolic regulators. Consideration of protein translation, and post-translational modifications, may provide further insight into the molecular alterations underlying the elevated glycolysis and oxidative phosphorylation in cells with higher metastatic capacity. Characterization of the metabolic changes correlated to enhance metastatic potential would deepen knowledge of metastatic mechanisms, and could facilitate the development of new strategies for therapeutic interventions and clinical management of patients with metastatic breast cancer.
Declarations
Authors’ contributionsDerived the MDA-MB-231HM.LNm5 line, generated the reporter gene tagged MDA-MB-231 and MDA-MB-231HMLNm5 lines: Johnstone CN
Conducted the Seahorse XF assays and contributed to the analysis and interpretation of the data: Ryall JG
Conducted the RNA-seq library preparation: Keenan CR
Analysed the FASTQ files from RNA sequencing: López-Campos GH
Conducted the majority of the experiments in the study, performed data analysis and interpretation, and drafted the article: Tu Y
Contribution to conception and design of the study: Tu Y, Johnstone CN, Stewart AG
Major contributor to the conception and design of described work, contributed to writing and editing of the manuscript, and will be the guarantor for this article: Stewart AG
Availability of data and materialsThe datasets generated during and/or analysed during the current study are available from the corresponding author on reasonable request.
Financial support and sponsorshipThis work was supported by the National Health and Medical Research Council of Australia (1059655, 1023185).
Conflicts of interestAll authors declared that there are no conflicts of interest.
Ethical approval and consent to participateNot applicable.
Consent for publicationNot applicable.
Copyright© The Author(s) 2018.
REFERENCES
1. Scully OJ, Bay BH, Yip G, Yu Y. Breast cancer metastasis. Cancer Genomics Proteomics 2012;9:311-20.
3. O’Shaughnessy J. Extending survival with chemotherapy in metastatic breast cancer. Oncologist 2005;10 Suppl 3:20-9.
7. Ward PS, Thompson CB. Metabolic reprogramming: a cancer hallmark even warburg did not anticipate. Cancer Cell 2012;21:297-308.
8. Xing Y, Zhao S, Zhou BP, Mi J. Metabolic reprogramming of the tumour microenvironment. FEBS J 2015;282:3892-8.
9. Munoz-Pinedo C, El Mjiyad N, Ricci JE. Cancer metabolism: current perspectives and future directions. Cell Death Dis 2012;3:e248.
10. Xu XD, Shao SX, Jiang HP, Cao YW, Wang YH, et al. Warburg effect or reverse Warburg effect? A review of cancer metabolism. Oncol Res Treat 2015;38:117-22.
11. Nakazawa MS, Keith B, Simon MC. Oxygen availability and metabolic adaptations. Nat Rev Cancer 2016;16:663-73.
12. Lu X, Bennet B, Mu E, Rabinowitz J, Kang Y. Metabolomic changes accompanying transformation and acquisition of metastatic potential in a syngeneic mouse mammary tumor model. J Biol Chem 2010;285:9317-21.
13. Simões RV, Serganova IS, Kruchevsky N, Leftin A, Shestov AA, et al. Metabolic plasticity of metastatic breast cancer cells: adaptation to changes in the microenvironment. Neoplasia (New York, NY) 2015;17:671-84.
14. Meadows AL, Kong B, Berdichevsky M, Roy S, Rosiva R, et al. Metabolic and morphological differences between rapidly proliferating cancerous and normal breast epithelial cells. Biotechnol Prog 2008;24:334-41.
15. Dupuy F, Tabaries S, Andrzejewski S, Dong Z, Blagih J, et al. PDK1-dependent metabolic reprogramming dictates metastatic potential in breast cancer. Cell Metab 2015;22:577-89.
16. Chen EI, Hewel J, Krueger JS, Tiraby C, Weber MR. Adaptation of energy metabolism in breast cancer brain metastases. Cancer Res 2007;67:1472-86.
17. LeBleu VS, O’Connell JT, Gonzalez Herrera KN, Wikman H, Pantel K, et al. PGC-1α mediates mitochondrial biogenesis and oxidative phosphorylation in cancer cells to promote metastasis. Nat Cell Biol 2014;16:992-1003, 1-15.
18. O’Flanagan CH, Rossi EL, McDonell SB, Chen X, Tsai YH, et al. Metabolic reprogramming underlies metastatic potential in an obesity-responsive murine model of metastatic triple negative breast cancer. NPJ Breast Cancer 2017;3:26.
19. Cailleau R, Mackay B, Young RK, Reeves WJ Jr. Tissue culture studies on pleural effusions from breast carcinoma patients. Cancer Res 1974;34:801-9.
20. Chang XZ, Li DQ, Hou YF, Wu J, Lu JS, et al. Identification of the functional role of AF1Q in the progression of breast cancer. Breast Cancer Res Treat 2008;111:65-78.
21. Chang XZ, Li DQ, Hou YF, Wu J, Lu JS, et al. Identification of the functional role of peroxiredoxin 6 in the progression of breast cancer. Breast Cancer Res 2007;9:R76.
22. Fietz ER, Keenan CR, Lopez-Campos G, Tu Y, Johnstone CN, et al. Glucocorticoid resistance of migration and gene expression in a daughter MDA-MB-231 breast tumour cell line selected for high metastatic potential. Sci Rep 2017;7:43774.
23. Johnstone CN, Pattison AD, Gorringe KL, Harrison PF, Powell DR, et al. Functional and genomic characterisation of a xenograft model system for the study of metastasis in triple-negative breast cancer. Dis Model Mech 2018;11:dmm032250.
24. Johnstone CN, Mongroo PS, Rich AS, Schupp M, Bowser MJ, et al. Parvin-beta inhibits breast cancer tumorigenicity and promotes CDK9-mediated peroxisome proliferator-activated receptor gamma 1 phosphorylation. Mol Cell Biol 2008;28:687-704.
25. Louis KS, Siegel AC. Cell viability analysis using trypan blue: manual and automated methods. Methods Mol Biol 2011;740:7-12.
26. Czekanska EM. Assessment of cell proliferation with resazurin-based fluorescent dye. Methods Mol Biol 2011;740:27-32.
27. Giraud J, Failla LM, Pascussi JM, Lagerqvist EL, Ollier J, et al. Autocrine Secretion of Progastrin Promotes the Survival and Self-Renewal of Colon Cancer Stem-like Cells. Cancer Res 2016;76:3618-28.
28. Johnstone CN, Castellvi-Bel S, Chang LM, Bessa X, Nakagawa H, et al. ARHGAP8 is a novel member of the RHOGAP family related to ARHGAP1/CDC42GAP/p50RHOGAP: mutation and expression analyses in colorectal and breast cancers. Gene 2004;336:59-71.
29. Liao Y, Smyth GK, Shi W. The Subread aligner: fast, accurate and scalable read mapping by seed-and-vote. Nucleic Acids Res 2013;41:e108.
30. Liao Y, Smyth GK, Shi W. featureCounts: an efficient general purpose program for assigning sequence reads to genomic features. Bioinformatics 2014;30:923-30.
31. Oshlack A, Robinson MD, Young MD. From RNA-seq reads to differential expression results. Genome Biol 2010;11:220.
32. Robinson MD, McCarthy DJ, Smyth GK. edgeR: a Bioconductor package for differential expression analysis of digital gene expression data. Bioinformatics 2010;26:139-40.
33. Calvo SE, Clauser KR, Mootha VK. MitoCarta2.0: an updated inventory of mammalian mitochondrial proteins. Nucleic Acids Res 2016;44:D1251-7.
34. Carbon S, Ireland A, Mungall CJ, Shu S, Marshall B, et al. AmiGO: online access to ontology and annotation data. Bioinformatics 2009;25:288-9.
35. Gray KA, Seal RL, Tweedie S, Wright MW, Bruford EA. A review of the new HGNC gene family resource. Hum Genomics 2016;10:6.
36. O’Brien J, Wilson I, Orton T, Pognan F. Investigation of the Alamar Blue (resazurin) fluorescent dye for the assessment of mammalian cell cytotoxicity. Eur J Biochem 2000;267:5421-6.
37. Gonzalez RJ, Tarloff JB. Evaluation of hepatic subcellular fractions for Alamar blue and MTT reductase activity. Toxicol In Vitro 2001;15:257-9.
38. Finley LW, Zhang J, Ye J, Ward PS, Thompson CB. SnapShot: cancer metabolism pathways. Cell Metab 2013;17:466.e2.
39. Li GH, Huang JF. Inferring therapeutic targets from heterogeneous data: HKDC1 is a novel potential therapeutic target for cancer. Bioinformatics 2014;30:748-52.
40. Minn AJ, Kang Y, Serganova I, Gupta GP, Giri DD, et al. Distinct organ-specific metastatic potential of individual breast cancer cells and primary tumors. J Clin Invest 2005;115:44-55.
41. Minn AJ, Gupta GP, Siegel PM, Bos PD, Shu W, et al. Genes that mediate breast cancer metastasis to lung. Nature 2005;436:518-24.
42. Wirapati P, Sotiriou C, Kunkel S, Farmer P, Pradervand S, et al. Meta-analysis of gene expression profiles in breast cancer: toward a unified understanding of breast cancer subtyping and prognosis signatures. Breast Cancer Res 2008;10:R65.
43. Sotiriou C, Wirapati P, Loi S, Harris A, Fox S, et al. Gene expression profiling in breast cancer: understanding the molecular basis of histologic grade to improve prognosis. J Natl Cancer Inst 2006;98:262-72.
44. Kang Y, Siegel PM, Shu W, Drobnjak M, Kakonen SM, et al. A multigenic program mediating breast cancer metastasis to bone. Cancer Cell 2003;3:537-49.
45. Hugo HJ, Gunasinghe N, Hollier BG, Tanaka T, Blick T, et al. Epithelial requirement for in vitro proliferation and xenograft growth and metastasis of MDA-MB-468 human breast cancer cells: oncogenic rather than tumor-suppressive role of E-cadherin. Breast Cancer Res 2017;19:86.
46. Muller V, Stahmann N, Riethdorf S, Rau T, Zabel T, et al. Circulating tumor cells in breast cancer: correlation to bone marrow micrometastases, heterogeneous response to systemic therapy and low proliferative activity. Clin Cancer Res 2005;11:3678-85.
47. Jerby L, Wolf L, Denkert C, Stein GY, Hilvo M, et al. Metabolic associations of reduced proliferation and oxidative stress in advanced breast cancer. Cancer Res 2012;72:5712-20.
48. Giese A, Loo MA, Tran N, Haskett D, Coons SW, et al. Dichotomy of astrocytoma migration and proliferation. Int J Cancer 1996;67:275-82.
49. Hatzikirou H, Basanta D, Simon M, Schaller K, Deutsch A. ‘Go or grow’: the key to the emergence of invasion in tumour progression? Math Med Biol 2012;29:49-65.
50. Pece S, Tosoni D, Confalonieri S, Mazzarol G, Vecchi M, et al. Biological and molecular heterogeneity of breast cancers correlates with their cancer stem cell content. Cell 2010;140:62-73.
51. Dembinski JL, Krauss S. Characterization and functional analysis of a slow cycling stem cell-like subpopulation in pancreas adenocarcinoma. Clin Exp Metastasis 2009;26:611-23.
52. Liu S, Cong Y, Wang D, Sun Y, Deng L, et al. Breast cancer stem cells transition between epithelial and mesenchymal states reflective of their normal counterparts. Stem Cell Reports 2014;2:78-91.
54. Shibue T, Weinberg RA. EMT, CSCs, and drug resistance: the mechanistic link and clinical implications. Nat Rev Clin Oncol 2017;14:611-29.
56. Pinheiro C, Garcia EA, Morais-Santos F, Moreira MA, Almeida FM, et al. Reprogramming energy metabolism and inducing angiogenesis: co-expression of monocarboxylate transporters with VEGF family members in cervical adenocarcinomas. BMC Cancer 2015;15:835.
57. Scatena R. Mitochondria and cancer: a growing role in apoptosis, cancer cell metabolism and dedifferentiation. Adv Exp Med Biol 2012;942:287-308.
58. Ho PC, Liu PS. Metabolic communication in tumors: a new layer of immunoregulation for immune evasion. J Immunother Cancer 2016;4:4.
59. Ludvik AE, Pusec CM, Priyadarshini M, Angueira AR, Guo C, et al. HKDC1 Is a Novel Hexokinase Involved in Whole-Body Glucose Use. Endocrinology 2016;157:3452-61.
60. Herman MA, Peroni OD, Villoria J, Schon MR, Abumrad NA, et al. A novel ChREBP isoform in adipose tissue regulates systemic glucose metabolism. Nature 2012;484:333-8.
61. Hitosugi T, Chen J. Post-translational modifications and the Warburg effect. Oncogene 2014;33:4279-85.
62. Clark O, Yen K, Mellinghoff IK. Molecular Pathways: isocitrate dehydrogenase mutations in cancer. Clin Cancer Res 2016;22:1837-42.
63. Santarpia L, Bottai G, Kelly CM, Gyorffy B, Szekely B, et al. Deciphering and targeting oncogenic mutations and pathways in breast cancer. Oncologist 2016;21:1063-78.
64. Tian GY, Zang SF, Wang L, Luo Y, Shi JP, et al. Isocitrate dehydrogenase 2 suppresses the invasion of hepatocellular carcinoma cells via matrix metalloproteinase 9. Cell Physiol Biochem 2015;37:2405-14.
Cite This Article
Export citation file: BibTeX | RIS
OAE Style
Tu Y, Johnstone CN, Ryall JG, López-Campos GH, Keenan CR, Stewart AG. Altered energy metabolism and metabolic gene expression associated with increased metastatic capacity identified in MDA-MB-231 cell line variants. J Cancer Metastasis Treat 2018;4:58. http://dx.doi.org/10.20517/2394-4722.2018.67
AMA Style
Tu Y, Johnstone CN, Ryall JG, López-Campos GH, Keenan CR, Stewart AG. Altered energy metabolism and metabolic gene expression associated with increased metastatic capacity identified in MDA-MB-231 cell line variants. Journal of Cancer Metastasis and Treatment. 2018; 4: 58. http://dx.doi.org/10.20517/2394-4722.2018.67
Chicago/Turabian Style
Tu, Yan, Cameron N. Johnstone, James G. Ryall, Guillermo H. López-Campos, Christine R. Keenan, Alastair G. Stewart. 2018. "Altered energy metabolism and metabolic gene expression associated with increased metastatic capacity identified in MDA-MB-231 cell line variants" Journal of Cancer Metastasis and Treatment. 4: 58. http://dx.doi.org/10.20517/2394-4722.2018.67
ACS Style
Tu, Y.; Johnstone CN.; Ryall JG.; López-Campos GH.; Keenan CR.; Stewart AG. Altered energy metabolism and metabolic gene expression associated with increased metastatic capacity identified in MDA-MB-231 cell line variants. J. Cancer. Metastasis. Treat. 2018, 4, 58. http://dx.doi.org/10.20517/2394-4722.2018.67
About This Article
Special Issue
Copyright

Data & Comments
Data


 Cite This Article 19 clicks

 Like This Article 15
likes
Like This Article 15
likes


Comments
Comments must be written in English. Spam, offensive content, impersonation, and private information will not be permitted. If any comment is reported and identified as inappropriate content by OAE staff, the comment will be removed without notice. If you have any queries or need any help, please contact us at support@oaepublish.com.