
Mass spectrometry-based metabolomic profiling of prostate cancer - a pilot study


Abstract
Aim: Prostate cancer (PCa) is the most commonly diagnosed non-skin cancer among men. Serum prostate-specific antigen level is used as a standard PCa biomarker for over 20 years. However, it has only 33% specificity and 86% sensitivity (for the cutoff value for prostate biopsy of > 4 ng/mL). This leads to overdiagnosis and overtreatment. In-depth insight into PCa metabolomics enables discovery of novel PCa biomarkers.
Methods: Metabolomic alternation in PCa serum, urine and interstitial fluid was examined using gold-nanoparticle-based laser mass spectrometry imaging. This study included 5 patients who underwent prostate biopsy with positive result, 5 patients with negative result and 10 healthy controls.
Results: Over two hundred differentiating metabolites (87 in urine, 54 in serum and 78 in interstitial fluid) were detected. Four, twenty two and ten metabolites from urine, serum and interstitial fluid respectively showed statistical significant differential abundance between cancer and control group.
Conclusion: Comprehensive metabolomic profile of PCa has been identified. Out of 36 metabolites, 20 were identified and should be further evaluated in clinical trials as a potential PCa biomarker. Urine concentration of triglyceride (12:0/20:1) showed over 10 times higher abundance in PCa samples in comparison to healthy controls and is considered the most promising potential biomarker.
Keywords
Introduction
Prostate cancer (PCa) is the most commonly diagnosed non-skin cancer and third leading cause of mortality after lung and colorectal cancer among men in Western World. Overall, during lifetime, 1 in 6 men will develop PCa and 1 in 33 will die from this disease. Moreover, at presentation 16% of patients will have locally advanced or metastatic disease. Life expectancy depends mainly on the stage and varies between < 5 years for metastatic disease to minimal risk of death at 15 years for organ-confined disease[1]. Historically PCa was diagnosed with digital rectal examination (DRE) followed by transperineal or digitally guided transrectal biopsy, often in advanced stage. Introduction of prostate-specific antigen (PSA) testing has revolutionized diagnosis of PCa and is shown to be the better predictor of cancer than DRE or transrectal ultrasound (TRUS). Traditional PSA cutoff value for prostate biopsy is > 4 ng/mL and has only 33% specificity and 86% sensitivity for detection of PCa. As a result patients with elevated PSA are overdiagnosed and overtreated. Decrease in mortality from PCa observed in most Western countries is considered partially to be the result of PCa screening with PSA. However, screening with PSA has become one of the most debated topics in urology and is dominated by the conflicting results of 2 randomized control trials: The European Randomized Study of Screening for Prostate Cancer (ERSPC)[2], which found a survival benefit due to screening with PSA (with the greatest benefit within Goteborg arm of ERSPC trial[3]) while the United States Prostate, Lung, Colorectal, and Ovarian Cancer Screening Trial[4] did not. As ERSPC study shows, to save one patient from PCa specific death, 1,055 men need to be screened and 37 patients need to be treated. Recent studies concluded that screening is associated with increased diagnosis of PCa, no PCa-specific or overall survival benefit and increased risk of overdiagnosis and overtreatment[5]. Therefore new diagnostic tools (multiparametric MRI) and biomarkers (PCA3, kallikreins and TMPRSS2-Erg fusion) are constantly being developed to increase sensitivity and specificity of PCa testing. Recently a number of novel PCa biomarkers have been developed. The most promising was developed by MDxHealth - SelectMDx. It is a genomic-based test that measures the expression of two PCa-related mRNAs in urine: HOXC6 and DLX1 in conjunction with clinical risk factors. It’s main advantage is the ability to diagnose patients with clinically significant cancer (Gleason score ≥ 7) which would be selected for prostate biopsy and to avoid identification of indolent PCa. SelectMDx negative predictive value is 98%[6]. According to Govers et al.[7] application of SelectMDx in clinical practice contributes to increased quality-adjusted life years while saving healthcare costs.
Biomarker research is based on analyzing differences in abundances of varied substances between cancerous tissue or biofluid and their healthy counterpart. This comparative analysis approach identifies and classifies the individual molecules. However, recently, a novel approach have been proposed and is called network-based analysis. Instead of focusing on specific molecule, emphasis is placed on whole cellular pathway and key molecules which are altered in the disease. Search for potential biomarkers has been conducted at every molecular level: genome, transcriptome, proteome and metabolome. Genomic and transcriptomic microarray, real time PCR and next gen. sequencing, proteomic and metabolomic mass spectrometry and nuclear magnetic resonance spectroscopy in combination with advanced bioinformatics tools allowed detailed insight into cancerogenesis. Metabolome, which is collection of all metabolites produced within cell is an endpoint of the “omics cascade” (genomics, proteomics, metabolomics) pathway and in comparison to genes and proteins which are subjected to epigenetic processes and post-translational modifications, is the most accurate representation of phenotype[8]. Recent advances in mass spectrometry enabled discovery of numerous metabolites specific for lung, colorectal, ovarian, prostate, renal, breast and liver cancer[9-17]. Metabolomic studies of PCa have led to the discovery of sarcosine as a potential marker of PCa. It has been demonstrated that elevated level of serum sarcosine is associated with PCa[18,19]. However the role of sarcosine as a potential PCa biomarker has been based on studies involving a small number of subjects and has been questioned following publication of the studies of larger cohort. de Vogel et al.[20] examined serum of 3000 patients with PCa and 3000 controls and showed that elevated serum levels of sarcosine were associated with decreased risk of PCa.
The difficulty in developing PCa biomarker results from the heterogeneity of this type of cancer. It has been demonstrated that factors like obesity and hormonal profile may be associated with increased risk of high grade PCa. de Cobelli et al.[21] demonstrated that high body mass index (BMI) is associated with upgrading and upstaging in patients with low-risk PCa. Moreover it has been shown that low testosterone level is a predictor of upstaging and upgrading in patents with low-risk PCa[22]. This results support inclusion of BMI and testosterone level into selection criteria for active surveillance programs.
In this study we evaluate the role of mass spectrometry in the metabolomic study of PCa and the possibility to develop potential novel PCa biomarker.
Methods
Protocol of this study was approved by the ethics committee at the University of Rzeszów, Poland (no. 14/06/2016). Specimens and clinical data related to this study were collected after signing informed consents. Data were prospectively collected from 10 patients with elevated PSA who underwent transrectal prostate biopsy and 10 healthy volunteers between December 2016 and February 2017 at Department of Urology, City Hospital in Rzeszów. Five out ten patients were diagnosed with PCa - 3 with Gleason 7, 1 with Gleason 8 and 1 with Gleason 9. Each biopsy was performed by the same urologist at our department with extensive experience in prostate biopsies (over 10,000 performed procedures) and was examined by dedicated genitourinary pathologist using 2005 International Society of Urological Pathology Gleason grading criteria. Exclusion criteria were: active acute urinary tract infection, bleeding disorder and bowel malignancies or inflammatory bowel diseases. Collected data included age, total PSA level, DRE examination result, TRUS calculated prostate volume and full pathological report. Standard 12-core TRUS guided biopsy was performed. Before procedure, single dose of i.v. ciprofloxacin was used as an antibiotic prophylaxis. Each core was placed into a separate container.
Decision to perform prostate biopsy was based on either elevated PSA level (higher or equal to 4.0 ng/mL) or positive DRE examination. For the purpose of metabolomic analysis, 10 mL of blood, 100 mL of urine and 50 µL of interstitial fluid (IF) extracted from each biopsy core were collected from each patient who has had prostate biopsy. Control group constituted of 10 young (< 40 years old, mean 28.7) healthy volunteers with average PSA of 0.7 ng/mL and average estimated PCa risk (using multivariable ERSPC cohort PCa risk calculator) of 2%. Each volunteer donated 10 mL of blood and 100 mL of urine, no biopsies were performed in this group. Whole blood was collected and centrifuged at 3000 rpm at room temperature for 10 min.
Preparation of samples for mass spectrometry imaging
Urine, serum and IF samples were immediately stored at -80 °C until use. Urine and blood plasma samples were diluted 600 times with water and placed on target plate (0.5 µL). Tissue samples were washed with 50 µL of water and directly placed on target plate (0.5 µL). All samples of the same type (for example all urine samples) were measured on the same target plate in one mass spectrometry imaging (MSI) experiment. Extracts were placed on target plate with the aid of 3D precision translation stage system with spot diameter ca. 1.5 mm.
Mass spectrometry measurements and data handling
Mass spectrometry (MS) analysis was performed using high-resolution laser desorption/ionization (LDI)-time-of-flight (ToF)-MS based on gold nanoparticle-enhanced target (AuNPET) plate[23] and is presented in simplified form in flowchart in Figure 1. AuNPET target plates of 2.5 × 3.5 cm size and ca. 0.8 mm thickness were used with Bruker NALDI adapter. AuNPET-based surface-assisted, LDI-ToF-MS experiments were performed using a Bruker Autoflex Speed ToF-MS in reflectron mode. Instrument was equipped with a SmartBeam II laser (352 nm). The laser impulse energy was approximately 60-120 µJ; the laser repetition rate was 1000 Hz; and the deflection value was set to m/z 80 Da. The first accelerating voltage was held at 19 kV and the second ion-source voltage was held at 16.7 kV. The reflector voltages used were 21 kV (first) and 9.55 kV (second). Measurement range was m/z 80-2000.
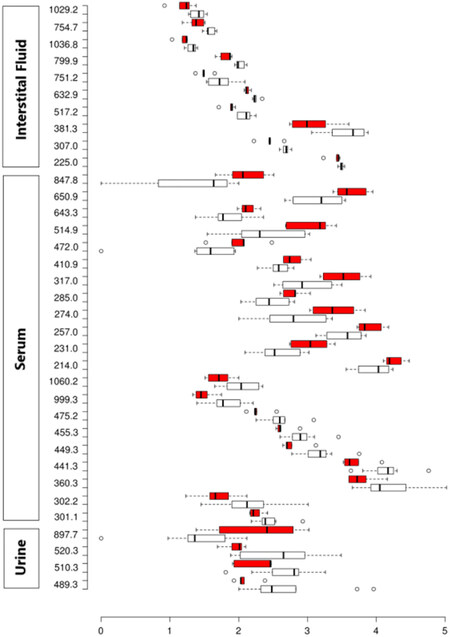
Figure 1. Box plot of all statistically significant (P < 0.05) metabolites. x-axis: log10 transformed mass spectrometry intensities (to reduce the impact of variability of high-intensity peaks, intensity axis has been transformed into a logarithmic one); y-axis: m/z values. Red boxes represent cancer, white boxes - control
Samples were placed on AuNPET plate semi-automatically with the aid of precise positioning of 3D translation stage which allowed precise orientation of commonly used pipette (Eppendorf Research plus). Application of described stage allowed much higher spot density and repeatability which would be rather impossible in manual manner. Semi-automated solution applied allowed measurements of over hundreds of samples on one custom-made target plates of 3.5 × 2.5 cm size.
For each sample spot, four measurement locations (pixels) were measured and resulting spectra averaged after preliminary re-calibration. Obtained quadruplicates were additionally recalibrated and normalized, the latter was based on three most abundant gold ion peaks.
Extracts were measured in MSI mode with 20,000 laser shots per individual pixel and four pixels per sample with 300 µm-lateral resolution. Bruker’s FlexImaging 4.0 software was used for setting of MSI experiments. Mass calibration was performed using internal standards (gold ions and clusters from Au+ to Au9+). Imaging data were converted to Analyze 7.5 and then to mzXML format and processed in mMass software. Obtained spectra were processed by application of baseline correction and recalibration. Spectra from four pixels of each spot were averaged and then again recalibrated. Intensities of averaged spectra of spots were normalized based on arithmetical mean of intensities of Au+, Au2+ and Au3+ ions with the use of software developed by our group. Resulting ion lists were then assigned with the use of monoisotopic masses available for metabolites enclosed in Human Metabolome Database (HMDB) and Pathos database within 10 ppm mass accuracy windows.
Study design
Serum and urine were collected from all the patients and categorized as follows: (1) no PCa (healthy volunteers, n = 10 patients); (2) presumptive benign disease (negative biopsy, n = 5 patients); (3) PCa (positive biopsy, n = 5 patients). IF collected from each prostate biopsy core was categorized as follows: (1) presumptive benign disease (negative biopsy, n = 5 patients); (2) PCa (positive biopsy, n = 5 patients). Each sample was analyzed using standardized MS protocol. Serum and urine specimens collected from patients with biopsy confirmed PCa were compared with those from healthy volunteers (no biopsy in this group). Serum and urine from patients with negative biopsy (no PCa) were excluded from this study due to lack of certainty that there is no PCa in non-biopsied regions of prostate. IF from positive biopsy cores were compared with those from negative cores. Patient characteristics are shown in Table 1.
Selected clinical characteristics of patients
| Characteristics | Controls (no prostate biopsy) (n = 10) | Study group (prostate biopsy) | |
|---|---|---|---|
| Positive (n = 5) | Negative (n = 5) | ||
| Age (years) | |||
| Mean | 28.7 | 71.4 | 66.8 |
| PSA (ng/mL), n (%) | |||
| PSA < 4 | 10 (100%) | 0 | 0 |
| PSA 4-10 | 0 | 2 (40%) | 1 (20%) |
| PSA 10-20 | 0 | 0 | 3 (60%) |
| PSA 20-50 | 0 | 2 (40%) | 1 (20%) |
| PSA > 50 | 0 | 1 (20%) | 0 |
| DRE | |||
| Suspected of PCa | 0 | 4 | 0 |
| Normal | 10 | 1 | 5 |
| Prostate volume (mL), n (%) | |||
| < 30 mL | 10 (100%) | 1 (20%) | 1 (20%) |
| 30-80 mL | 0 | 3 (60%) | 4 (80%) |
| > 80 mL | 0 | 1 (20%) | 0 |
| PCa risk (%) | |||
| Mean | 2 | 77.2 | 42.6 |
| Gleason grade, n (%) | |||
| 6 | - | 0 | - |
| 7 | - | 3 (60%) | - |
| 8 | - | 1 (20%) | - |
| 9 | - | 1 (20%) | - |
Results
All statistically significant metabolites (P < 0.05) are shown in Table 2. Statistical analysis was performed using SPSS and R software package. Four, twenty-two and ten metabolites from urine, serum and IF respectively showed statistical significant (P < 0.05) differential abundance between cancer and control group via Mann-Whitney U test. In addition, metabolites with m/z values of 897.7 (urine) and 307.0 (IF) were positively correlated with prostate volume (Spearman’s rho = 0.564, P = 0.028 and 0.648, P = 0.043 respectively). Differences between cancer/control intensities have been presented in the form of box- [Figure 1] and volcano-plot [Figure 2] graphs. Peaks obtained from MS analyses were identified and analyzed in the context of metabolic pathways in which they appear within Pathos and HMDB.
Urine, serum and interstitial fluid metabolites (P < 0.05) sorted by m/z values, chemical formula, chemical class, metabolic pathway, cancer to control ratio and P-value
| m/z | Chemical formula | Metabolite* | Metabolic pathway | Cancer to control ratio | P-value |
|---|---|---|---|---|---|
| Urine | |||||
| 489.3 | [C27H46O4S+H]+ | Cholesterol sulfate | Cholesterol metabolism | 0.08 | 0.03 |
| 510.3 | [C23H45N5O5+K]+ | Ile-Ile-Lys-Val and other isomers | Peptide | 0.30 | 0.04 |
| 520.3 | [C21H33N11O5+H]+ | Ala-Arg-His-His and other isomers | Peptide | 0.10 | 0.05 |
| 897.7 | [C55H102O6+K]+ | Triglyceride (12:0/20:1) and other isomers | Lipid metabolism | 10.39 | 0.04 |
| Serum | |||||
| 302.2 | [C16H31NO4+H]+ | Nonanoylcarnitine | Carnitine-type compound | 0.27 | 0.05 |
| 441.3 | [C22H42O7+Na]+ | Palmitoyl glucuronide | Fatty acid metabolism | 0.33 | 0.01 |
| 449.3 | [C30H50+H]+ | Squalene | Steroid biosynthesis | 0.37 | 0.01 |
| 455.3 | [C27H44O+K]+ | Calcitriol | Steroid biosynthesis | 0.47 | 0.02 |
| 475.2 | [C18H30O2+H]+ | (9Z, 12Z, 15Z)-octadecatrienoic acid | alpha-Linolenic acid metabolism | 0.45 | 0.01 |
| 999.3 | - | unknown | - | 0.44 | 0.03 |
| 214.0 | [C6H7O6+K]+ | Monodehydroascorbate | Ascorbate metabolism | 1.77 | 0.05 |
| 231.0 | [C6H12N2O3S+K]+ | Ala-Cys and other isomers | Peptide | 2.77 | 0.04 |
| 257.0 | [C6H8O9S+H]+ | Ascorbate 2-sulfate | Ascorbate metabolism | 2.13 | 0.05 |
| 285.0 | [C9H10O7S+Na]+ | Homovanillicacidsulfate | - | 1.89 | 0.04 |
| 410.9 | [C4H7O8P+H]+ | 2-Oxo-3-hydroxy-4-phosphobutanoate | Vitamin B6 metabolism | 1.67 | 0.04 |
| 515.0 | [C10H15N4O13P3+H]+ | dITP | Purine metabolism | 2.99 | 0.04 |
| 643.3 | [C32H44N8O5+Na]+ | Arg-Leu-Phe-Trp and other isomers | Peptide | 1.71 | 0.04 |
| 650.9 | - | unknown | - | 2.65 | 0.03 |
| 711.0 | - | unknown | - | 3.53 | 0.04 |
| 847.9 | - | unknown | - | 3.73 | 0.02 |
| Interstitial fluid | |||||
| 225.0 | [C7H6O6+H]+ | Maleylpyruvate | Tyrosine metabolism | 0.82 | 0.05 |
| 307.0 | [C9H11N2O8P+H]+ | 3.2’,3’-Cyclic uridine monophosphate | Pyrimidine metabolism | 0.61 | 0.03 |
| 517.2 | [C21H36O2+H]+ | Pregnanediol | Steroid hormone biosynthesis | 0.59 | 0.01 |
| 632.9 | - | unknown | 0.75 | 0.01 | |
| 751.2 | [C21H34N10O8+Au]+ | Arg-Asp-Gln-His and other isomers | Peptide | 0.51 | 0.03 |
| 754.7 | - | unknown | 0.64 | 0.03 | |
| 799.9 | - | unknown | 0.63 | 0.01 | |
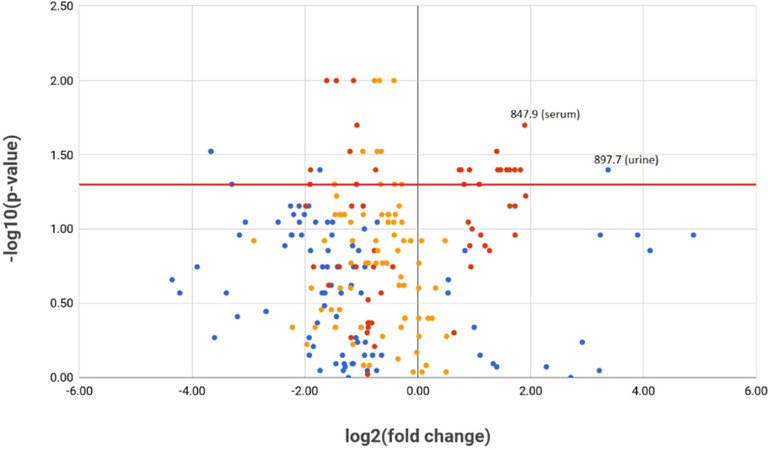
Figure 2. Volcano plot, all differentiating metabolites. Blue dots: urine metabolites; red dots: serum metabolites; orange dots: interstitial fluid metabolites. All substances above red horizontal line are statistically significant (P < 0.05). Two enumerated metabolites in upper right quadrant represent m/z values of most promising, potential urine and serum prostate cancer biomarkers
Discussion
In this study, a new methodology for rapid metabolomic analysis of human physiological liquids is proposed. MS measurements in imaging mode based on LDI apparatus, with the use of AuNPET target plate, simplify all of the necessary experimental procedures and thus greatly speed-up the experimental part of the analysis. For the imaging experiment presented in this work, the timeframe contained ~10 min of sample application to the target and ~20 min of measurements. It should be noted that rapid analysis has additional advantages such as ability to preserve chemically labile low-molecular weight compounds. Additionally, it is of extreme importance that no chemicals were added to the analyzed samples. It is important to state that sample preparation was one of the simplest possible in terms of procedure as it required only dilution of unfrozen samples. For the first time, in this study, the AuNPET LDI-TOF-MS method was used to study metabolites originating from human urine, blood plasma and prostate IF. Methodology of measurements is shown on Figure 3.
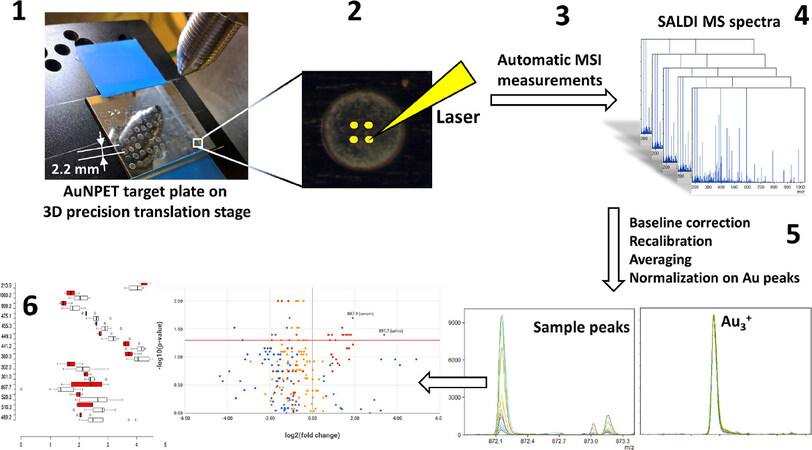
Figure 3. Flowchart for MSI analysis of interstitial fluid, urine and blood plasma samples on AuNPET target. Step 1: semi-manual application of diluted samples onto AuNPET target with the aid of 3D translation stage; 2: programming of four-pixel array per sample spot; 3, 4, 5: LDI MS measurements in imaging mode producing series of spectra; 6: data processing. MSI: mass spectrometry imaging; AuNPET: gold nanoparticle-enhanced target; SALDI: surface-assisted, laser desorption ionization; LDI: laser desorption/ionization
The decision not to examine prostate tissue but interstitial fluid was dictated by ethical and technical considerations. On one hand, fresh biopsy cores would have to be contained in high vacuum and thus they would be unfit for further pathological examination. Another possible analytical solution compatible with pathologist’s examination is analysis of formalin-fixed/paraffin embedded cores. Unfortunately, only 40% of total metabolites is retained in tissue material for the mentioned type of analysis. In comparison to fresh/frozen specimens, it would introduce many contaminants like dimethyl sulfoxide, lauryl sulfate or melanin into MS analysis[24]. IF which constitutes tumor microenvironment, often overlooked, has showed to be a highly valuable source of potential cancer biomarkers and a potential target for chemoprevention[25,26].
Uncontrolled cancer cell proliferation requires efficiency in generation of energy. However, unfavorable tumor microenvironment (low level of oxygenation) impose activation of alternative metabolic pathways to ensure further development. First adaptive mechanism has been described by Otto Warburg in 1920 who discovered that malignant cells produces energy predominantly through anaerobic pathway (glycolysis), even in the presence of oxygen (Warburg effect). This increased utilization of glucose in cancer cells formed basis for positron emission tomography (PET), nuclear medicine imaging system, which uses radiolabeled analog of glucose to diagnose cancer. However, since then numerous studies have demonstrated association between alteration in glutamine, lipid and cholesterol metabolism and cancerogenesis. This is accompanied by increased uptake of exogenous lipids and activation of its intracellular synthesis. With respect to PCa, alterations of lipid and cholesterol metabolism has been broadly studied. Fatty acid beta-oxidation pathway is believed to be dominant energetic source for PCa, which is considered to be non-glycolytic type of tumor[27,28]. This hypothesis is supported by low uptake of fluorodeoxyglucose on PET imaging[29].
Dysregulation in cholesterol metabolism has been implicated in the pathogenesis of PCa. It is essential for cell proliferation by participation in membrane formation and steroid biosynthesis which is cornerstone of prostate cancerogenesis. It is also believed that it can play a major role in cancer progression to the castration resistant state by fueling intratumoral androgen biosynthesis in androgen deprived patient[30,31]. This is possible due to activity of CYP17A1 enzyme, which is overexpressed in castrate resistant PCa[32]. Cholesterol biosynthesis pathway including production of squalene by condensing two molecules of farnesyl pyrophosphate by squalene synthase (farnesyl diphosphate farnesyltransferase 1). Squalene is then transformed with the aid of squalene monooxygenase (SQLE) to lanosterol. In the final step, lanosterol is converted to cholesterol through a 19-step process.
Decreased cancer/control ratio of serum squalene was observed in this study. Increased utilization of squalene by PCa cell should be accompanied by increased activity of SQLE. This observation is consistent with the study by Stopsack et al.[33] which showed that men with high SQLE expression are 8.3 times more likely to develop lethal PCa.
Elevated serum cholesterol and triglycerides (TG) has been linked with increased risk of developing aggressive PCa and recurrence after radical prostatectomy[33-36]. However there is discrepancy between studies concerning association between serum lipids level and overall risk of developing PCa[37-39].
Eberlin et al.[40] showed that cholesterol sulfate (CS) which is the product of cholesterol sulfotransferase - SULT2B1 (within cells cholesterol occurs in form of esters, CS or hydroxycholesterol), accumulates in PCa and achieves higher concentration in comparison to benign prostate tissue. However, in our study, levels of CS in biofluids of cancer patients have not been elevated. Moreover, in comparison to control, a statistically significant decrease of intensity in urine has been observed (P < 0.05).
Another interesting aspect of affinity of PCa cells to adipose-rich environment is fact that most common metastatic sites are lymph nodes and bone marrow. This environment provides sufficient TG which are hydrolyzed to fatty acids to fuel mitochondrial beta-oxidation and ATP generation[28,41]. This observation initiated research of new generation of drugs that target lipid metabolism[28,42]. In this study increased intensity of TG in urine of PCa patients has been observed.
Fatty acids transport inside mitochondria is possible by its conjugation to carnitine. Giskeødegård et al.[43] reported elevated serum level of four acyl carnitines in PCa patients in comparison to benign prostatic hyperplasia (BPH) control and Saylor et al.[44] observed decrease in serum acyl carnitines concentration after 3 months of androgen deprivation therapy. In comparison, no acyl carnitines was elevated in our study, moreover, serum nonanoylcarnitine intensity of PCa patients was decreased in comparison to control (P = 0.05).
One of the most studied dietary-factor related with PCa risk is daily intake of omega-3 fatty acids, however results are still inconsistent. Only alpha-linolenic acid (ALA) out of all n-3 polyunsaturated fatty acids (ALA, eicosapentaenoic acid, docosapentaenoic acid, and docosahexaenoic acid) is essential (cannot be synthesized in the body and must be obtained from food). Recent meta-analysis showed only marginally significant negative association between PCa risk and intake of ALA and no significant association between ALA blood concentration and PCa risk[45]. In this study serum ALA intensity was statistically significant lower in patients with PCa in comparison to control (P < 0.05).
Relationship between vitamin D (and its active metabolite - calcitriol) intake and its serum level and risk of PCa has been broadly studied. Vitamin D deficiency is associated with increased odds of PCa on biopsy and it is positively associated with higher PCa grade and stage[46,47]. Moreover, calcitriol used alone or as a part of combination therapy is being studied in clinical trials to treat PCa[48-50]. This is explained by the effect of vitamin D in promoting cellular apoptosis and differentiation and inhibiting cancer proliferation and angiogenesis. By decreasing expression of COX-2 gene it reduces proliferative stimulus of prostaglandin, a COX-2 product[51,52]. Our study supports observation that serum vitamin D deficiency is relevant in pathogenesis of PCa.
Another interesting observation is higher abundance of vitamin C metabolites in the serum of patients with PCa. Relationship between daily intake of vitamin C and risk of developing PCa is highly debatable and the results are conflicting. Its antineoplastic properties are attributed to its antioxidative properties which protects DNA and RNA from oxidative damage. However at high doses it may act as a pro-oxidant rather than antioxidant[53]. In our study elevated serum concentration of vitamin C metabolites in serum of patients with PCa has been observed.
The proliferative state of carcinoma requires both amino acids and nucleic acids to fuel cell division. We observed increased level of different amino acids in serum and simultaneously its decreased level in urine and IF. Interestingly commercially available urine test for patients with negative DRE examination and modestly elevated PSA level has been developed which is based on a panel of four amino acids: sarcosine, alanine, glycine and glutamic acid (Prostaririx™). Accumulation of modified nucleotides in a chemical process of deamination is characteristic for cellular processes involving DNA and RNA[54]. Deaminated nucleotides (such as dITP) can be incorporated into either DNA and RNA which may result in nucleic acid instability, mistranslation and strand damage which may induce cancerogenesis[55]. In this study we observed elevated level of dITP in serum of patients with PCa.
In conclusion, this study identifies comprehensive metabolomic profile of PCa. To the best of our knowledge, this is the first study which examined PCa IF. Moreover it combines simultaneous metabolomic analysis of serum, urine and IF, which gives most accurate insight into prostate cancerogenesis. Gold-nanoparticle-based laser MSI allowed identification of 20 metabolites which are up- and down-regulated. Identified metabolites mentioned in this study suggest their role in PCa pathogenesis and should be further evaluated in clinical trials as potential PCa biomarkers. The limitations of this study were the relatively small number of participants and the fact that small percentage of intensity values can be age-related for urine and plasma samples.
Declarations
AcknowledgmentsWe also thank German and Polish Bruker-Daltonics for FlexImaging 4.0. Mr. Dominik Ruman is acknowledged for creating search engine of chemical compounds and 3D stage control program.
Authors’ contributionsSample collection: Ossoliński K, Ossolińska A, Ossoliński T
Sample processing, MS and MSI measurements: Nizioł J, RumanT, Arendowski A
Data analysis: RumanT, Nizioł J
Statistical analysis: Ossoliński K, Ruman T
Analysis of medical aspects of research: Ossoliński K, Kucharz J, Wiechno P
Availability of data and materialsNot applicable.
Financial support and sponsorshipScientific work was funded by Ministry of Science and Higher Education Republic of Poland from the budget for science in the years 2016-2020 as a research project within the program “Diamond Grant” (0184/DIA/2016/45).
Conflicts of interestAll authors declared that there are no conflicts of interest.
Ethical approval and consent to participateThe authors state that they have obtained the appropriate consent of the local bioethics commission to carry out the research and in addition, for investigations involving human subjects, informed consent has been obtained from the participants involved.
Consent for publicationNot applicable.
Copyright© The Author(s) 2019.
REFERENCES
2. Schröder FH, Hugosson J, Roobol MJ, Tammela TL, Ciatto S, et al. Screening and prostate-cancer mortality in a randomized European study. N Engl J Med 2009;360:1320-8.
3. Hugosson J, Carlsson S, Aus G, Bergdahl S, Khatami A, et al. Mortality results from the Göteborg randomised population-based prostate-cancer screening trial. Lancet Oncol 2010;11:725-32.
4. Andriole GL, Crawford ED, Grubb RL, Buys SS, Chia D, et al. Mortality results from a randomized prostate-cancer screening trial. N Engl J Med 2009;360:1310-9.
5. Hayes JH, Barry MJ. Screening for prostate cancer with the prostate-specific antigen test: a review of current evidence. JAMA 2014;311:1143-9.
6. Van Neste L, Hendriks RJ, Dijkstra S, Trooskens G, Cornel EB, et al. Detection of high-grade prostate cancer using a urinary molecular biomarker-based risk score. Eur Urol 2016;70:740-8.
7. Govers TM, Hessels D, Vlaeminck-Guillem V, Schmitz-Dräger BJ, Stief CG, et al. Cost-effectiveness of SelectMDx for prostate cancer in four European countries: a comparative modeling study. Prostate Cancer Prostatic Dis 2018; doi: 10.1038/s41391-018-0076-3.
8. Patti GJ, Yanes O, Siuzdak G. Innovation: metabolomics: the apogee of the omics trilogy. Nat Rev Mol Cell Biol 2012;13:263-9.
9. Diamandis EP. Mass spectrometry as a diagnostic and a cancer biomarker discovery tool: opportunities and potential limitations. Mol Cell Proteomics 2004;3:367-78.
10. Yang J, Zhu Y, Guo H, Wang X, Gao R, et al. Identifying serum biomarkers for ovarian cancer by screening with surface-enhanced laser desorption/ionization mass spectrometry and the artificial neural network. Int J Gynecol Cancer 2013;23:667-72.
11. Wright GL Jr, Cazares LH, Leung SM, Nasim S, Adam BL, et al. Proteinchip(R) surface enhanced laser desorption/ionization (SELDI) mass spectrometry: a novel protein biochip technology for detection of prostate cancer biomarkers in complex protein mixtures. Prostate Cancer Prostatic Dis 1999;2:264-76.
12. Ocak S, Chaurand P, Massion PP. Mass spectrometry-based proteomic profiling of lung cancer. Proc Am Thorac Soc 2009;6:159-70.
13. Martínez-Aguilar J, Chik J, Nicholson J, Semaan C, McKay MJ, et al. Quantitative mass spectrometry for colorectal cancer proteomics. Proteomics Clin Appl 2013;7:42-54.
14. Wu B, Abbott T, Fishman D, McMurray W, Mor G, et al. Ovarian cancer classification based on mass spectrometry analysis of sera. Cancer Inform 2007;2:123-32.
15. Nizioł J, Ossoliński K, Ossoliński T, Ossolińska A, Bonifay V, et al. Surface-transfer mass spectrometry imaging of renal tissue on gold nanoparticle enhanced target. Anal Chem 2016;88:7365-71.
16. Whelan SA, He J, Lu M, Souda P, Saxton RE, et al. Mass spectrometry (LC-MS/MS) identified proteomic biosignatures of breast cancer in proximal fluid. J Proteome Res 2012;11:5034-45.
17. Xue R, Dong L, Zhang S, Deng C, Liu T, et al. Investigation of volatile biomarkers in liver cancer blood using solid-phase microextraction and gas chromatography/mass spectrometry. Rapid Commun Mass Spectrom 2008;22:1181-6.
18. Lucarelli G, Rutigliano M, Galleggiante V, Giglio A, Palazzo S, et al. Metabolomic profiling for the identification of novel diagnostic markers in prostate cancer. Expert Rev Mol Diagn 2015;15:1211-24.
19. Ferro M, Lucarelli G, Bruzzese D, Perdonà S, Mazzarella C, et al. Improving the prediction of pathologic outcomes in patients undergoing radical prostatectomy: the value of prostate cancer antigen 3 (PCA3), prostate health index (phi) and sarcosine. Anticancer Res 2015;35:1017-23.
20. de Vogel S, Ulvik A, Meyer K, Ueland PM, Nygård O, et al. Sarcosine and other metabolites along the choline oxidation pathway in relation to prostate cancer - a large nested case-control study within the JANUS cohort in Norway. Int J Cancer 2014;134:197-206.
21. de Cobelli O, Terracciano D, Tagliabue E, Raimondi S, Galasso G, et al. Body mass index was associated with upstaging and upgrading in patients with low-risk prostate cancer who met the inclusion criteria for active surveillance. Urol Oncol 2015;33:201.
22. Ferro M, Lucarelli G, Bruzzese D, Di Lorenzo G, Perdonà S, et al. Low serum total testosterone level as a predictor of upstaging and upgrading in low-risk prostate cancer patients meeting the inclusion criteria for active surveillance. Oncotarget 2017;8:18424-34.
23. Sekuła J, Nizioł J, Rode W, Ruman T. Gold nanoparticle-enhanced target (AuNPET) as universal solution for laser desorption/ionization mass spectrometry analysis and imaging of low molecular weight compounds. Anal Chim Acta 2015;875:61-72.
24. Cacciatore S, Zadra G, Bango C, Penney KL, Tyekucheva S, et al. Metabolic profiling in formalin-fixed and paraffin-embedded prostate cancer tissues. Mol Cancer Res 2017;15:439-47.
25. Sund M, Kalluri R. Tumor stroma derived biomarkers in cancer. Cancer Metastasis Rev 2009;28:177-83.
26. Albini A, Sporn MB. The tumour microenvironment as a target for chemoprevention. Nat Rev Cancer 2007;7:139-47.
27. Liu Y, Zuckier LS, Ghesani NV. Dominant uptake of fatty acid over glucose by prostate cells: a potential new diagnostic and therapeutic approach. Anticancer Res 2010;30:369-74.
28. Beloribi-Djefaflia S, Vasseur S, Guillaumond F. Lipid metabolic reprogramming in cancer cells. Oncogenesis 2016;5:e189.
29. Liu IJ, Zafar MB, Lai YH, Segall GM, Terris MK. Fluorodeoxyglucose positron emission tomography studies in diagnosis and staging of clinically organ-confined prostate cancer. Urology 2001;57:108-11.
30. Mostaghel EA, Solomon KR, Pelton K, Freeman MR, Montgomery RB. Impact of circulating cholesterol levels on growth and intratumoral androgen concentration of prostate tumors. PLoS One 2012;7:e30062.
31. Twiddy AL, Leon CG, Wasan KM. Cholesterol as a potential target for castration-resistant prostate cancer. Pharm Res 2011;28:423-37.
32. Montgomery RB, Mostaghel EA, Vessella R, Hess DL, Kalhorn TF, et al. Maintenance of intratumoral androgens in metastatic prostate cancer: a mechanism for castration-resistant tumor growth. Cancer Res 2008;68:4447-54.
33. Stopsack KH, Gerke TA, Sinnott JA, Penney KL, Tyekucheva S, et al. Cholesterol metabolism and prostate cancer lethality. Cancer Res 2016;76:4785-90.
34. Allott EH, Howard LE, Cooperberg MR, Kane CJ, Aronson WJ, et al. Serum lipid profile and risk of prostate cancer recurrence: results from the SEARCH database. Cancer Epidemiol Biomarkers Prev 2014;23:2349-56.
35. Platz EA, Till C, Goodman PJ, Parnes HL, Figg WD, et al. Men with low serum cholesterol have a lower risk of high-grade prostate cancer in the placebo arm of the prostate cancer prevention trial. Cancer Epidemiol Biomarkers Prev 2009;18:2807-13.
36. Mondul AM, Clipp SL, Helzlsouer KJ, Platz EA. Association between plasma total cholesterol concentration and incident prostate cancer in the CLUE II cohort. Cancer Causes Control 2009;21:61-8.
37. Kok DE, van Roermund JG, Aben KK, den Heijer M, Swinkels DW, et al. Blood lipid levels and prostate cancer risk; a cohort study. Prostate Cancer Prostatic Dis 2011;14:340-5.
38. Wuermli L, Joerger M, Henz S, Schmid HP, Riesen WF, et al. Hypertriglyceridemia as a possible risk factor for prostate cancer. Prostate Cancer Prostatic Dis 2005;8:316-20.
39. Platz EA, Clinton SK, Giovannucci E. Association between plasma cholesterol and prostate cancer in the PSA era. Int J Cancer 2008;123:1693-8.
40. Eberlin LS, Dill AL, Costa AB, Ifa DR, Cheng L, et al. Cholesterol sulfate imaging in human prostate cancer tissue by desorption electrospray ionization mass spectrometry. Anal Chem 2010;82:3430-4.
41. Liu Y. Fatty acid oxidation is a dominant bioenergetic pathway in prostate cancer. Prostate Cancer Prostatic Dis 2006;9:230-4.
42. Flavin R, Peluso S, Nguyen PL, Loda M. Fatty acid synthase as a potential therapeutic target in cancer. Future Oncol 2010;6:551-62.
43. Giskeødegård GF, Hansen AF, Bertilsson H, Gonzalez SV, Kristiansen KA, et al. Metabolic markers in blood can separate prostate cancer from benign prostatic hyperplasia. Br J Cancer 2015;113:1712-9.
44. Saylor PJ, Karoly ED, Smith MR. Prospective study of changes in the metabolomic profiles of men during their first three months of androgen deprivation therapy for prostate cancer. Clin Cancer Res 2012;18:3677-85.
45. Fu YQ, Zheng JS, Yang B, Li D. Effect of individual omega-3 fatty acids on the risk of prostate cancer: a systematic review and dose-response meta-analysis of prospective cohort studies. J Epidemiol 2015;25:261-74.
46. Murphy AB, Nyame Y, Martin IK, Catalona WJ, Hollowell CM, et al. Vitamin D deficiency predicts prostate biopsy outcomes. Clin Cancer Res 2014;20:2289-99.
47. Gilbert R, Metcalfe C, Fraser WD, Donovan J, Hamdy F, et al. Associations of circulating 25-hydroxyvitamin D with prostate cancer diagnosis, stage and grade. Int J Cancer 2011;131:1187-96.
48. Ben-Eltriki M, Deb S, Guns ES. Calcitriol in combination therapy for prostate cancer: pharmacokinetic and pharmacodynamic interactions. J Cancer 2016;7:391-407.
49. Marshall DT, Savage SJ, Garrett-Mayer E, Keane TE, Hollis BW, et al. Vitamin D3 supplementation at 4000 international units per day for one year results in a decrease of positive cores at repeat biopsy in subjects with low-risk prostate cancer under active surveillance. J Clin Endocrinol Metab 2012;97:2315-24.
50. Beer TM, Ryan CW, Venner PM, Petrylak DP, Chatta GS, et al. Double-blinded randomized study of high-dose calcitriol plus docetaxel compared with placebo plus docetaxel in androgen-independent prostate cancer: a report from the ASCENT investigators. J Clin Oncol 2007;25:669-74.
51. Krishnan AV, Moreno J, Nonn L, Swami S, Peehl DM, et al. Calcitriol as a chemopreventive and therapeutic agent in prostate cancer: role of anti-inflammatory activity. J Bone Miner Res 2007;22:V74-80.
52. Moreno J, Krishnan AV, Feldman D. Molecular mechanisms mediating the anti-proliferative effects of Vitamin D in prostate cancer. J Steroid Biochem Mol Biol 2005;97:31-6.
53. Podmore ID, Griffiths HR, Herbert KE, Mistry N, Mistry P, et al. Vitamin C exhibits pro-oxidant properties. Nature 1998;392:559.
54. Davies O, Mendes P, Smallbone K, Malys N. Characterisation of multiple substrate-specific (d)ITP/(d)XTPase and modelling of deaminated purine nucleotide metabolism. BMB Rep 2012;45:259-64.
Cite This Article
Export citation file: BibTeX | RIS
OAE Style
Ossoliński K, Nizioł J, Arendowski A, Ossolińska A, Ossoliński T, Kucharz J, Wiechno P, Ruman T. Mass spectrometry-based metabolomic profiling of prostate cancer - a pilot study. J Cancer Metastasis Treat 2019;5:1. http://dx.doi.org/10.20517/2394-4722.2018.63
AMA Style
Ossoliński K, Nizioł J, Arendowski A, Ossolińska A, Ossoliński T, Kucharz J, Wiechno P, Ruman T. Mass spectrometry-based metabolomic profiling of prostate cancer - a pilot study. Journal of Cancer Metastasis and Treatment. 2019; 5: 1. http://dx.doi.org/10.20517/2394-4722.2018.63
Chicago/Turabian Style
Ossoliński, Krzysztof, Joanna Nizioł, Adrian Arendowski, Anna Ossolińska, Tadeusz Ossoliński, Jakub Kucharz, Paweł Wiechno, Tomasz Ruman. 2019. "Mass spectrometry-based metabolomic profiling of prostate cancer - a pilot study" Journal of Cancer Metastasis and Treatment. 5: 1. http://dx.doi.org/10.20517/2394-4722.2018.63
ACS Style
Ossoliński, K.; Nizioł J.; Arendowski A.; Ossolińska A.; Ossoliński T.; Kucharz J.; Wiechno P.; Ruman T. Mass spectrometry-based metabolomic profiling of prostate cancer - a pilot study. J. Cancer. Metastasis. Treat. 2019, 5, 1. http://dx.doi.org/10.20517/2394-4722.2018.63
About This Article
Special Issue
Copyright

Data & Comments
Data


 Cite This Article 26 clicks

 Like This Article 12
likes
Like This Article 12
likes


Comments
Comments must be written in English. Spam, offensive content, impersonation, and private information will not be permitted. If any comment is reported and identified as inappropriate content by OAE staff, the comment will be removed without notice. If you have any queries or need any help, please contact us at support@oaepublish.com.