
A pilot study for distinguishing basal cell carcinoma from normal human skin tissues using visible resonance Raman spectroscopy


Abstract
Aim: The aim of the study is to test visible resonance Raman (VRR) spectroscopy for rapid skin cancer diagnosis, and evaluate its effectiveness as a new optical biopsy method to distinguish basal cell carcinoma (BCC) from normal skin tissues.
Methods: The VRR spectroscopic technique was undertaken using 532 nm excitation. Normal and BCC human skin tissue samples were measured in seconds. The molecular fingerprints of various native biomolecules as biomarkers were analyzed. A principal component analysis - support vector machine (PCA-SVM) statistical analysis method based on the molecular fingerprints was developed for differentiating BCC from normal skin tissues.
Results: VRR provides a rapid method and enhanced Raman signals from biomolecules with resonant and near-resonant absorption bands as compared with using a near-infrared excitation light source. The VRR technique revealed chemical composition changes of native biomarkers such as tryptophan, carotenoids, lipids and proteins. The VRR spectra from BCC samples showed a strong enhancement in proteins including collagen type I combined with amide I and amino acids, and a decrease in carotenoids and lipids. The PCA-SVM statistical analysis based on the molecular fingerprints of the biomarkers yielded a 93.0% diagnostic sensitivity, 100% specificity, and 94.5% accuracy compared with histopathology reports.
Conclusion: VRR can enhance molecular vibrational modes of various native biomarkers to allow for very fast display of Raman modes in seconds. It may be used as a label-free molecular pathology method for diagnosis of skin cancer and other diseases and be used for combined treatment with Mohs surgery for BCC.
Keywords
Introduction
Several studies have reported that skin cancer is in an increasing trend worldwide. Each year, new cases of skin cancer have been reported to have a greater incidence than breast, prostate, lung and colon cancers combined. Basal cell carcinoma (BCC) is the most common skin cancer, accounting for about 80% of the non-melanoma skin cancers (NMSC) which includes BCC and squamous cell carcinoma (SCC). Before the age of 65, 40%-50% Americans will have BCC or SCC skin disease occurring. There are about 4 million cases of BCC diagnosed in the USA annually[1-4]. Although BCC lesions rarely metastasize and have a high curable rate, they frequently expand quickly and may not only become a cosmetic problem but infiltrate surrounding tissue causing functional problems. Therefore, early detection and rapid and accurate diagnosis become very important for treatment.
Currently, clinical routine diagnosis of skin cancer is performed using biopsy and histopathology. The gold standard method requires freezing or reagent preparation of the biopsy tissue prior to microscopic analysis. This requires skilled technicians and expert histopathologists to perform the diagnosis, as well as considerable time before the results are available. This leads to a diagnostic accuracy of about 80% depending on expertise and training[5-9]. A new diagnostic technique that is more rapid with higher accuracy would be a great clinical advantage. A search is ongoing for a fast and accurate way for diagnosis while treating cancers.
An optical biopsy (OB) technique would offer many advantages including in situ evaluating lesions. There is a panoply of OB techniques, such as label-free native fluorescence, Raman spectroscopy (RS), optical coherent tomography, and other optical imaging techniques for ex vivo and in vivo cancer detection in human tissues and cells. These techniques have advanced significantly since the earliest reports in 1984, 1987, 1991 and 1992 by Alfano’s group[10-13]. In particular, OB techniques for ex vivo detection of a panoply of different cancer types such as NMSC have progressed in recently years. Some fluorescence spectroscopic techniques for diagnosis of BCC have been reported, such as fluorescence confocal microscopy that has been used to detect BCC skin cancer margin in Mohs excisions without the need of frozen and fixed section processing[14-20]. RS technique has some unique features such as using intrinsic biomarkers and operating in situ and in a time period of many minutes or seconds. This has led to a rapid progress in seeking commercial instrumentation for researchers and clinical applications in BCC and other skin cancer diagnoses[21-36]. Most of the reports demonstrated spectral differences between normal skin tissue and BCC lesions using near-infrared (NIR) laser excitation only. Some reported the use of high power and very long signal collection time (e.g., 300 mW of power and minutes of time) on cells and tissues[24,25]. The NIR Raman method which uses excitation light sources at 671 nm, 785 nm, 830 nm or 1,060 nm has limitations for practical applications described as follows: (1) NIR Raman method only detects non-resonant biomolecule components; (2) NIR laser source requires long excitation time. Even a confocal micro Raman system has poor signal-to-noise (S/N) ratio since the spectral peaks are weak and not enhanced. Increasing excitation light intensity and longer exposure time will limit the practical application[24,26,30]; and (3) The NIR light penetrates relatively deep and excites a large volume in the skin compared to visible light. Thus, it is subjected to variations in the molecular content of the target tissue yielding a low selectivity distinguishing the abnormal from the normal target sites.
We have recently developed a novel visible resonance Raman (VRR) technique using 532 nm as the excitation source which can address the aforementioned limitations of NIR RS technique and extend the Raman technique so that it detects both non-resonant and resonant biomedical components. The vibrational resonance effect occurs in resonance Raman (RR) spectroscopy when the energy of the excitation approaches an optical transition energy level, which greatly enhances the scattering. The RR signal intensity may be enhanced 102 to 103 times, typically 10 to 100 folds, compared with non-resonance signal, since Raman scattering cross section is inversely proportional to the fourth power of the wavelength. In particular, RR using 488 nm and 532 nm excitation wavelengths gives almost seven and five times more intense Raman signal than using 785 nm excitation wavelength, respectively.
One will have many advantages of resonance Raman over conventional non-resonance Raman if 532 nm is used for excitation in biomedical diagnosis. Since cells and tissues contain many large biomolecular chromophores and other large conjugated molecules with multiple vibrational bonds, they experience stretching and bending vibrations that can be enhanced by the excitation laser and the RR spectra collected from them exhibit enhanced peaks. Specific biomolecules in the cell and organelles contain fluorophores, such as flavins, NADH, NAD, collagens, elastin, carotenoids, tryptophan, hemeproteins, mitochondria and cytochromes. The resonance enhanced signals from these biomolecules suggest that the 532 nm excitation wavelength matched (or closely matched) the molecular absorption bands for these biochemical compounds in the cells and tissues. For example, the metalloprotein such as hemoglobin, has one absorption band at 534 nm. Similarly, the mitochondrial electron transport protein, cytochrome c, has one absorption band at 552 nm (under the hypoxia conditions). The 532 nm is in the tail of the absorption band of flavins and lactate. Carotenoids and flavins have pre-resonance absorption bands about 480 nm and 500 nm which fall in the pre-resonance range of the excitation wavelength of 532 nm. The molecular vibrations of flavins were enhanced by more than 100 times. Therefore, the VRR spectral peaks are greatly enhanced, and much sharper than those from NIR non-resonance Raman. The first RR using 488 nm and 514 nm was noticed in cancer tissue by Alfano et al.[11] in 1987. The VRR method has been used to produce enhanced S/N results in the biomedical fields. More recently, the VRR technique has been used on human brain, breast, vulnerable atherosclerotic plaque, gynecological tissues, gastrointestinal tissues, and atherosclerotic abdominal aortic tissues studies[37-43]. The VRR spectra ex vivo exhibited native molecular signatures that could be used as optical molecular histopathological criteria to distinguish abnormal from normal tissues. The 532 nm wavelength is like a “magic” wavelength for tissue to generate extraordinarily high Raman signals for quasi real-time measurements. It is just inside the key fluorophores’ absorption and emission regions in tissue.
This study focuses on VRR spectral analysis of normal and BCC human skin tissues performed ex vivo using a confocal micro-Raman system. It investigates the depth dependence of BCC which reveals a process of status change, and demonstrates the discrimination and classification between normal and BCC skin tissues using molecular vibrational fingerprints and a statistical model. The statistical model is based on principal component analysis (PCA)[44] and supports vector machine (SVM)[43,45-48]. To the best of our knowledge, this study is the first to detail and discuss the depth dependence of BCC in correlation with statuses, and to distinguish BCC from normal skin tissue using the VRR technique. This is a pilot study on BCC skin cancer using VRR performed as a basis for longer studies using 532 nm and other visible laser wavelengths.
Methods
RR spectra of sliced samples of human skin normal and BCC tissues were measured using a confocal micro-Raman spectrometer, with a 532 nm laser for excitation at low power (3.5 mW) for under 30 s. Fifty-five RR spectra were obtained and analyzed from thirty-six slices of skin tissue samples.
Tissue sample preparation
The human skin normal and BCC specimens were obtained from the National Disease Research Interchange (NDRI, Philadelphia, PA) under the City College of CUNY Institutional Review Board (IRB). The BCC tissue was from the left ear of a 77-year-old white male. The normal skin sample was from the adjacent area of this BCC tissue. The RR spectra of sliced BCC and normal skin samples were measured, including 28 vertical section slices from one BCC sample and 8 horizontal section slices from one normal sample. Each slice is approximately 8.4 mm long and 5.6 mm wide with a thickness of 50 µm. One vertical section slice of BCC sample was selected for measurement at 6 steps of depths with 100 µm step size, and 9 steps of depths with 500 µm step size, starting from the top surface of the skin toward the bottom as shown in Figure 1.
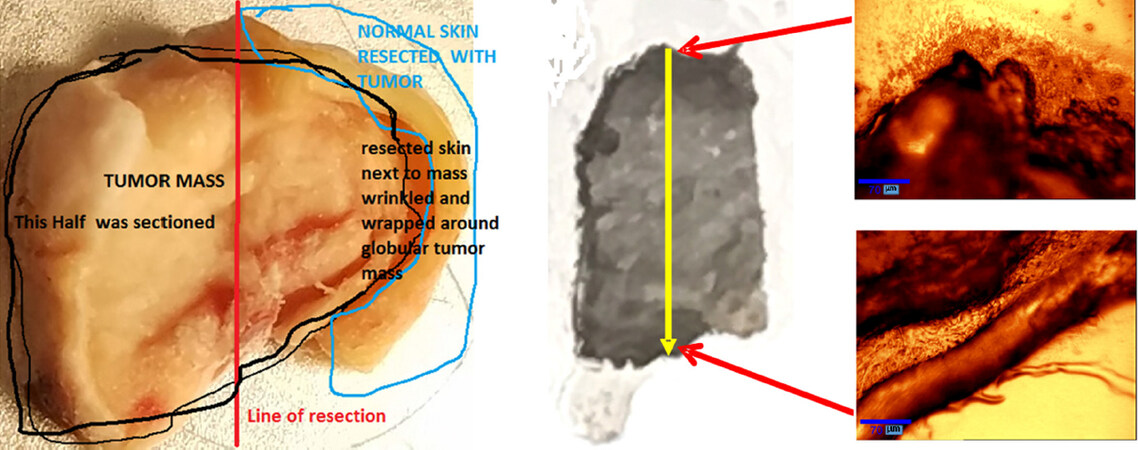
Figure 1. A photograph (side view) of the original human BCC skin specimen used in the experiments (left). The specimen was sliced in vertical direction indicated by the red line. Twenty-eight slices were made with 50 µm thickness for each slice. In the middle is the photograph of a piece of vertical slice of BCC with the size of 5.6 mm × 8.3 mm × 50 µm, where the yellow arrow indicates the direction of measurement steps in depth. The right images were taken from the top and bottom edges of the BCC slice. The red arrows show the sites at the top and bottom of the slice where the two images are taken. BCC: basal cell carcinoma
The irregular-shaped skin specimens were snap-frozen with no chemical treatment. They were kept in a -80 °C freezer and shipped with dry ice for all tests. Tissue sections were cut with a thickness of 50 µm and mounted on uncoated glass microscope slides using Leica CM1080 Cryostats at -20 oC. The specimens were thawed to ambient room temperature for the spectroscopic studies.
Measurement of RR spectra of BCC and normal skin sliced tissues
All of the RR spectra were collected directly from a region of interest on each sliced specimen. The raw RR spectrographs (without subtracting the baseline) were produced using the software of NGSlabSpec and ORIGIN 2015. A total of 55 spectra were collected from normal and BCC tissues at the following sites: 12 spectra from eight sections of normal specimen; 15 spectra from one vertical section of BCC sample that was selected for measurements at 6 depths with 100 µm separation, and 9 depths with 500 µm separation; and 28 spectra from the centers of 28 vertically sliced sections of BCC sample. Typical spectra are shown in Figure 2.
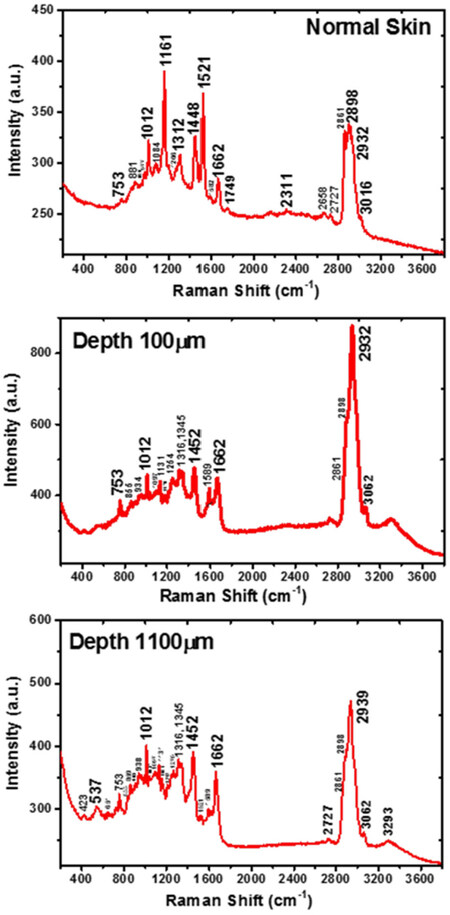
Figure 2. A set of typical resonance Raman raw spectra collected from a horizontal section of normal human skin sample, and a vertically sliced BCC skin sample measured at different depths. (Top), the spectrum was from dermis layer of normal skin showing nine feature peaks; (middle), the spectrum was from the vertically sliced BCC sample at a depth of 100 µm. There are eight characteristic peaks including increased peaks at 753 cm-1 and 1,589 cm-1, but intense carotenoids peaks at 1,161 cm-1 and 1,521 cm-1 disappeared compared to the normal tissue (top); (bottom), the spectrum was from BCC sample at a depth of 1,100 µm, substantially similar to the depth of 100 µm, with six Raman peaks, but carotenoids peaks at 1,161 cm-1 and 1,521 cm-1 are present and obviously weaker than normal tissue sample (top). Those peaks of 753 cm-1 and 1,589 cm-1 greatly decreased in comparison with the depth of 100 µm. BCC: basal cell carcinoma
The instrument used in this study was WITec alpha300 Raman microscope system (WITec: Wissenschaftliche Instrumente und Technologie GmbH, Ulm, Germany), equipped with a Nikon 20X objective (Nikon Instruments, Melville, NY, USA). The excitation light source was a 532 nm solid-state diode laser (Verdi-2, Coherent Company, Santa Clara, CA, USA) with a maximum output power of 50 mW. Each piece of slices was placed on the stage of the system to collect data. The excitation beam was focused on the sample with a spot diameter of 1 μm and the power of the beam at the sample position was kept at 3.5 mW. RR spectra were collected using a one-second integration time and 30 accumulations, with a system resolution down to the optical diffraction limit of ~200 nm. The spectra were collected over the spectral range of 400-4000 cm-1. The spectral resolution was 2 cm-1 in the range of interest[41,42]. All the spectra were collected at ambient room temperature. Student’s t-test was used to determine if particular RR peak intensities between normal and BCC samples were significantly different.
RR spectral data analysis method by PCA-SVM
The baseline of each raw Raman spectrum was fitted to a polynomial using an asymmetric Huber function as the loss function[49]. The difference between the raw spectra and the baselines were calculated. Each baseline-subtracted Raman spectrum was then normalized using its Euclidean norm, and used for subsequent analysis.
Raman peaks in the normalized baseline-subtracted Raman spectra were first investigated. Student’s t-test was used to determine if particular RR peak intensities between normal and BCC samples were significantly different. Then unsupervised machine learning algorithms such as PCA were used to analyze the entire spectral data, reduce dimension and detect underlying spectral feathers.
PCA finds the uncorrelated components that explain the most variance in the signal. It has been widely used for various applications, such as spectroscopy[50], face recognition[51] and optical imaging[52]. Mathematically, PCA solves an eigenvalue equation, and finds a set of orthonormal eigenvectors which are considered principal components (PCs) corresponding to the eigenvalues which are the variances of the PCs in the data. For Raman spectral data contained in a matrix XM×N = {x1, …, xN}, where M is the number of wavenumbers, and N is the number of spectra or samples (assuming M > N). PCA considers the spectral data xi to be linear combinations of PC loadings {wj} with scores {hji}, i.e., XM×N ≈ WM×NHN×N, where WM×N = {w1, … wN} and HN×N = {h1, …, hN}. To calculate the PCs, the data matrix is “mean centered” first, i.e., the mean of each row is calculated and subtracted off that row. Then an eigenvalue equation of the covariance matrix of the “mean centered” data matrix X’ is solved to find the eigenvectors and the corresponding eigenvalues. The eigenvectors are the PC loadings, and eigenvalues are the variances explained by the corresponding PCs. In practice, this can be solved using singular value decomposition[53] of the data matrix X’, i.e., X’ = U∑VT, where U and V are left and right singular vectors, and σi = diag{∑} are the singular values. Columns of UM×N are taken to be the PC loadings, i.e., W = U, eigenvalues λi = σi2, H = pinv(W)X, where pinv denotes pseudo inverse, and pinv(W) = (WTW)-1WT.
The PC scores contained in H are essentially the projection of the spectral data in matrix X onto the PCs or “eigenspectra”. The PC scores hi are a set of mixing coefficients of the PCs. These scores can be considered as the characteristic information of the spectra (samples) and used for classification. Alternatively, PC scores obtained from the mean-centered data matrix can also be used, and they are simply different from those obtained from the raw data with a shift in the origin.
Then the PC scores of different spectra (samples) were used for classification after standardization. The scores were standardized for each spectrum using the following formula: (score - “score mean”)/“score standard deviation”. An SVM with a linear kernel was used for classification. SVM attempts to find a hyperplane (a boundary line in two dimension) to separate two classes with the largest distance from the nearest class members (data points) which are called support vectors. Once the SVM classifier is trained, it is tested for classification using all the data points, which is called re-substitution validation. Various combinations of features were tested for classification. Since the contributions due to higher-order PCs significantly decrease according to the eigenvalues, limited number of PCs need to be evaluated and compared. More thorough search of optimal feature selection may be carried out[47,48]. The classification performance of the SVM classifier was evaluated using statistical measures including sensitivity, specificity, and accuracy, along with the receiver operating characteristic (ROC) curve[54,55]. To plot the ROC curve for the SVM classifier, the positive class (cancer) posterior probability (a data point classified into positive class) for each data point was calculated by using a sigmoid function to map the SVM scores which are the distances from the data points to the SVM separation line[56]. Then the posterior probabilities were used to calculate the true positive rate (i.e., sensitivity) and false positive rate (i.e., 1 - specificity) by varying the threshold and generate the ROC curve for true positive rate vs. false positive rate. The area under ROC curve (AUROC)[55,57] was calculated to show the performance of the classifier. AUROC represents the probability that a classifier will rank a randomly chosen positive sample before a randomly chosen negative one. It is used as a global measure of classifier performance that is invariant to the classifier discrimination threshold and the class distribution. Perfect classification accuracy corresponds to an AUROC value of 1, while a random guess separation leads to an AUROC value of 0.5. To reduce bias in the classification with re-substitution, leave-one-out cross validation (LOOCV)[58] was used to re-evaluate the classification performance. To perform LOOCV, each time one individual spectrum was removed from the dataset. The rest of the dataset was used to train an SVM classifier. The removed spectrum was then classified by the trained classifier for testing. This process was repeated for all spectra. In the end, sensitivity, specificity and accuracy were calculated based on the results of all testing as overall evaluation of the classification performance. All the computations for PCA-SVM were carried out in MATLAB.
Results
RR raw spectra from horizontally sliced normal and BCC cancerous human skin samples in vertically section were measured. The distinctive Raman peaks that can be uniquely assigned to distinguish skin cancer lesions were obtained by the raw spectral profiles. The correlation between depth and the status of BCC cancer was found using the RR molecular fingerprints [Figures 2 and 3], by investigating the relative changes of biomarkers [Figure 4] and by calculating the ratios of peak intensities [Figure 5]. The classification of BCC cancer from normal skin tissues using PCA-SVM statistical method is shown in Figure 6.
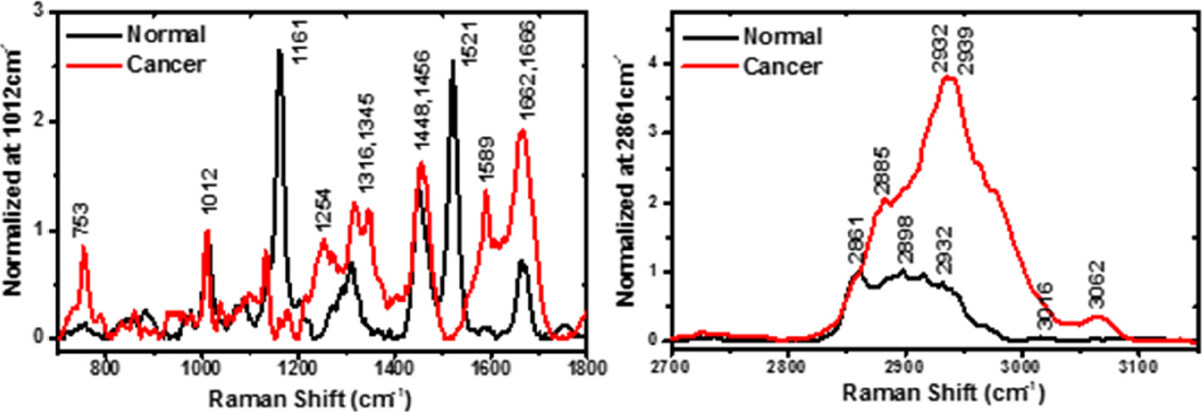
Figure 3. A set of typical resonance Raman spectra collected from a horizontally sectioned normal human skin sample, and a vertically sliced basal cell carcinoma skin sample measured at a depth of 100 µm. Both plots are displayed in the enlarged scale regions of low wave-number 700-1,800 cm-1 and high wave-number 2,700-3,150 cm-1
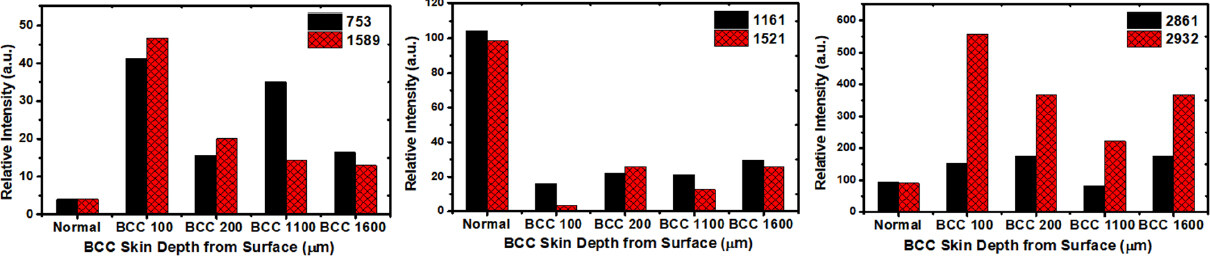
Figure 4. The relative concentration changes in biomarkers of tryptophan (left), carotenoids (middle) and lipids/lipoproteins (right) in the normal skin tissue and BCC skin tissues with depth-dependence. Dramatic changes on relative concentrations are shown for the lesion slices at the depth of 100 µm compared with other depths of 200 µm, 1,100 µm and 1,600 µm. Based on student’s t-test, the difference between normal and BCC samples is statistically significant (P < 0.05) for biomarkers: 752, 1,161 and 1,521 cm-1. The units of the numbers in the figure legends are cm-1. BCC: basal cell carcinoma
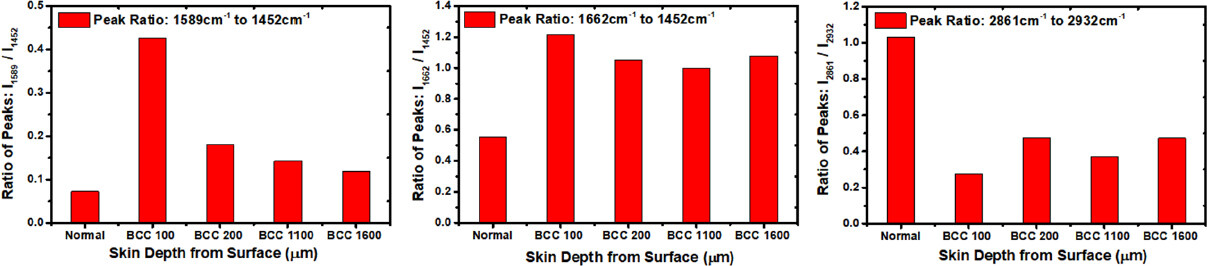
Figure 5. The changes in the resonance Raman fingerprints represented by the ratios of peak intensities of biomarkers. The 1,589 cm-1 mode is supposed to be arising from tryptophan; 1,452 cm-1 mode is assigned to fatty acids-lipid protein molecules; 1,662 cm-1 mode is amide I combined with type I collagen; the largest ratio (I1589 to I1452) changes occurred at a depth of 100 µm in the BCC tissue (left). Based on student’s t-test, the difference between normal and BCC samples is shown to be statistically significant (P < 0.05) for all biomarkers. BCC: basal cell carcinoma
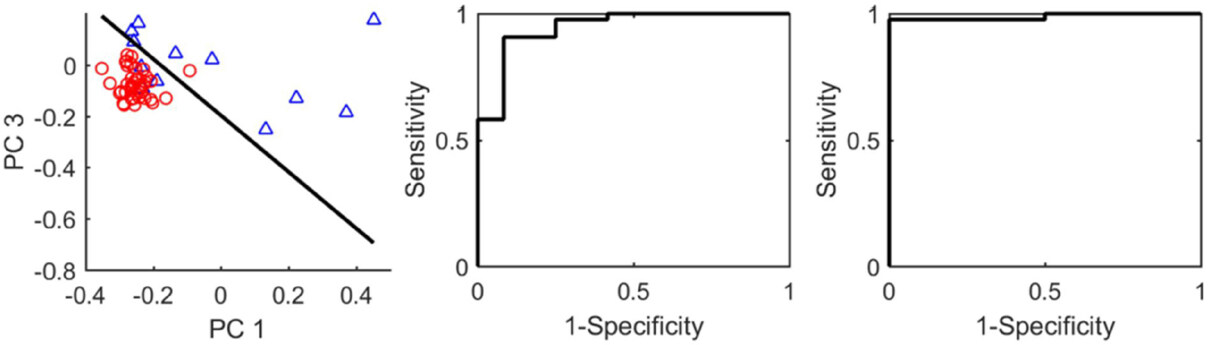
Figure 6. (left) is a scatter plot of scores PC1 and PC3 with the separation line (SVM classifier); (middle) ROC curve for the SVM classifier in the left panel; (right) ROC curve for the SVM classifier trained with PC1, PC3 and PC7. PC: principal component; ROC: receiver operating characteristic; SVM: supports vector machine
Depth-dependent BCC assay: (1) VRR spectral fingerprints
RR spectral fingerprints of carotenoids: Figures 2 and 3 and Table 1 show the typical spectra from normal and cancerous BCC sliced skin samples. It revealed the process of evolution from normal to cancer and depth-dependence of cancer from different status with RR spectral fingerprints. The RR spectrum [Figure 2 (top)] was obtained from the center of the third piece of horizontally sliced normal sample with thickness 50 µm. The depth is around 150 µm in the normal skin tissue (corresponding to the lower epidermis layer and the dermis layer). The epithelium is usually ~0.1 mm thick, and ranges from 0.07 to 0.12 mm. The dermis is a layer of skin which is beneath the epidermis layer and is the thickest of the three layers (epidermis, dermis and hypodermis) of skin[59-62]. The dermis is also called corium, whose thickness is 0.3-4.0 mm and it is composed of dense irregular connective tissue. So, we consider this normal sliced sample to be located at the dermis layer. In the RR spectrum of normal dermis skin, the resonance-enhanced intrinsic molecular fingerprints of β-carotenes (here we consider β-carotenes, because the β-carotenes and lycopene account for about 60%-70% of the total of the five most concentrated carotenoids content in human organisms), at 1,161 cm-1 and 1,521 cm-1 are thought to play a significant role in the normal dermis skin anti-oxidant defense system, as shown in Figure 2 (top) and Figure 3 (left). These two resonance bands are active because carotenoids have a pre-resonance absorption band which falls in the pre-resonance range of the excitation wavelength of 532 nm[37,63-67]. The RR peaks of 1,161 cm-1 and 1,521cm-1 disappeared in the BCC sliced sample at a depth of 100 µm as shown in Figure 2 (middle) and Figure 3 (left). This shows a clear progression of the BCC tissue mutation process in comparison with normal skin tissue, which suggests it may be a lesion with very serious status. The spectrum shown in Figure 2 (bottom) is from vertically sliced BCC sample at a depth of 1,100 µm, substantially similar to the BCC sliced at a depth of 100 µm, with RR peaks present at 1,012 cm-1, 1,452 cm-1, 1,662 cm-1, 2,861 cm-1, 2,898cm-1 and 2,932 cm-1. But carotenoids peaks occurring at 1,161 cm-1 and 1,521 cm-1 are obviously weaker than normal tissue sample [Figure 2 (top)], which suggest this status may be a mildly lesion. Thus, we propose that the evolution of the RR spectra of biomarker carotenoids with the depth dependence revealed the correlation between depth and the process of status change. Carotenoids are the organic and natural fat-soluble pigments and exist in plants. Human beings can obtain carotenoids from diet, such as fruits and vegetables, and its concentration depends on their daily diet and stress factor[67,68]. Carotenoids accumulate in the epidermis through (1) diffusion from the fat tissue, blood and lymph flows, or (2) secretion via sweat glands, and sebaceous glands onto the surface of the skin and subsequent penetration. The specific importance of carotenoids is to serve as a marker substance for the entire anti-oxidative network of human skin[69,70]. Because antioxidants form protective chains in skin tissue, they act synergistically to protect each other against the destructive action of the free radicals, and mainly reactive oxygen species[69-73].
Changes in intensities of peaks in the resonance Raman spectra of human normal skin tissues compared with basal cell carcinoma skin tissues in Figure 3
| Peak position (cm-1) | Normal | BCC | Suggested molecular class |
|---|---|---|---|
| 753 | Enhanced | Trp. DNA | |
| 859 | Polyadenylic acid, collagen type I, lactate | ||
| 1,012 | Trp. | ||
| 1,161 | Intense | Carotenoids | |
| 1,254 | Enhanced | Amide III, Trp. | |
| 1,316, 1,345 | Enhanced | Trp. collagen, A, G, T | |
| 1,452 | Collagen type I, phospholipid | ||
| 1,521 | Intense | Carotenoids | |
| 1,588 | Enhanced | Trp. heme class, Phe, A, G | |
| 1,662, 1,666 | Enhanced | Amide I, collagen | |
| 2,861-2,892 | Lipids, collagen | ||
| 2,932, 2,939 | Enhanced | Lipoprotein, collagen, lactate |
RR spectral fingerprints of tryptophan: in contrast, the RR peaks of 1,161 cm-1 and 1,521 cm-1 diminished sharply for BCC tissues at a depth of 100 µm while the fingerprints of tryptophan peak at 753 cm-1 and 1,589 cm-1 greatly increased in BCC tissue at a depth of 100 µm in a more serious status [Figure 2 (middle), Figure 3 (left) and Table 1], but decreased in the BCC sliced sample at a depth of 1,100 µm in a mild status [Figure 2 (bottom)]. The RR spectra of key fingerprints of tryptophan with a main vibrational mode at 1,588 cm-1 (W8b) were observed[66,74]. It was found that endogenous tryptophan and metabolites contributions were accumulated in the mode of 1,588 cm-1 in cancers and enhanced by resonance. Researchers have reported that heterocyclic amino acid tryptophan is a key factor during the metabolic process[74,75]. This RR vibrational mode of 1,588 cm-1 indicates that tryptophan may be produced in human skin cancer in the kynurenine pathway of tryptophan metabolism involved in tumor progression according to our previous studies on human brain cancer[75-77] and that the micro-environment of malignant tumor tissues may result from tryptophan radicals[78-80].
RR spectral fingerprints of lipids and lipoprotein: the characteristic band of spectral peaks observed between 2,861 cm-1/2,898 cm-1 and 2,932 cm-1 are attributed to the vibrations of methylene (-CH2) from lipids and methyl (-CH3-) groups from lipoproteins [Figure 3 (right), Figure 4 (right) and Table 1]. The peak near 2,932 cm-1, due to the asymmetric C-H stretching of methyl groups, showed a significant increase in BCC cancer tissue at a depth of 100 µm site, while the 2,861 cm-1/2,898 cm-1 band relatively decreased in intensity in BCC cancer tissue at a depth of 100 µm in comparison to RR spectrum of the normal skin tissue.
Depth-dependent BCC assay: (2) relative content changes of molecular fingerprints
Figure 4 showed the relative content changes of biomarkers of carotenoids (left), tryptophan (middle) and lipids/lipoproteins (right) in normal skin tissue vs. BCC cancer skin tissues with depth-dependence. The dramatic changes in relative concentrations are shown in the slice at depth 100 µm which is a BCC lesion in comparison to other status BCC lesions at depths of 200 µm, 1,100 µm and 1,600 µm. These results are consistent with the analysis of RR spectral fingerprints in the previous section. The suggested reason for the spectral changes of carotenoids is that the concentration of carotenoids decreased in BCC cancer at the depth of 100 µm, which caused the RR peaks to become too weak to detect and induced a shift in chemical vibration bonds. This change in carotenoids may be due to the structural changes within the micro-environment of malignant lesion. All these observations point out the existence of fast activation and deactivation of Raman vibrational modes.
Depth-dependent BCC assay: (3) ratio of intensity of molecular fingerprints vibration modes
Figure 5 showed the RR fingerprints changes using the ratio of the intensities of RR peaks. The 1,589 cm-1 mode is attributed to tryptophan; while the 1,452 cm-1 mode is assigned to the fatty acid/lipid protein molecules and the 1,662 cm-1 mode is from the amide I combined with the collagen type I molecules. The largest ratio changes of (I1589 to I1452), (I1662 to I1452) and (I2861 to I2932) occurred at a depth of 100 µm from the BCC tissue samples. These ratios of the intensities of the spectral peaks from the BCC cancer tissue at depth 100 µm are found to be much higher [Figure 5 (left and middle)] or lower [Figure 5 (right)] in comparison with those from normal skin tissue, therefore they may be used as a distinct marker to distinguish cancerous tissues from normal skin tissues. Such ratios provide an insight into the conformational changes occurring in biomolecules in these tissues. For instance, the Raman spectra of proteins (represented by the 1,662 cm-1 band) correspond to beta-sheets which provide insight into protein folding or the denaturation processes.
Classification based on RR spectral data of BCC and normal skin tissues by SVM
The spectral dataset including 12 spectra from sliced normal skin tissues, and 43 spectra from sliced BCC cancerous samples were analyzed using PCA. Fifty-five PCs were obtained with corresponding eigenvalues sorted in a descent order (the plots are not shown here). The first 10 PCs account for 97% of the total variance. If two PCs are selected for classification, first PC (PC1) and third PC (PC3) showed the best performance. The scatter plot of the PC scores along with a boundary line trained using SVM method is shown in Figure 6 (left). The sensitivity, specificity and accuracy of the classifier with re-substitution validation were calculated to be 97.7%, 75.0%, and 92.7%, respectively. The ROC curve was generated and shown in Figure 6 (middle). The AUROC was found to be 0.95. When PC1, PC3 and PC7 are used together for classification, it achieved optimal performance. Sensitivity, specificity and accuracy of the SVM classifier trained with all spectra were found to be 93.0%, 100%, and 94.5% with re-substitution validation. The ROC curve was generated and shown in Figure 6 (right). The AUROC was found to be 0.99. LOOCV achieved sensitivity 97.7%, specificity 66.7%, and accuracy 90.9%. The classification is shown to be effective for the diagnosis of human skin tissues using RR spectroscopy.
Discussion
In conclusion, given our preliminary investigation, we have demonstrated how the molecular components and conformation change under different conditions of BCC skin cancer tissues, and shown that there is a correlation between the depth dependence of RR spectra and the status change of BCC tissue at a molecular level. At a depth of 100 µm, the VRR spectra from BCC tissue change significantly compared to the spectra from normal skin tissues due to the changes in the relative concentrations of tryptophan, carotenoids, lipids and proteins Figures 2-5. In addition, VRR technique with 532 nm excitation can effectively distinguish BCC from normal skin tissues. The PCA-SVM statistical analyses of the VRR data collected from human skin cancer and normal tissues were used to distinguish BCC lesions from normal skin tissues. It yielded a sensitivity, specificity and accuracy of 93.0%, 100%, and 94.5%, respectively, when compared with the histopathology analysis (as the “gold standard”) reports. This is the first evidence that the difference between human skin normal tissues and cancer lesions can be detected by VRR spectroscopy.
The VRR method has a high S/N ratio, and provides visually intuitive results for inspection. Even the raw RR spectra can be used for a direct comparison between cancerous and normal tissues. In contrast, it is much more difficult to inspect the raw Raman data acquired using NIR such as 785 nm excitation, because of the much lower S/N ratio. In fact, the raw Raman spectra are rarely provided in the literature[81,82]. The VRR system also uses less power and shorter integration time to collect signals[28,29,31,32], thus providing a safer and more suitable method for in vivo and real-time in-situ skin cancer diagnosis compared with other NIR or FT-Raman system. We believe we cannot obtain Raman spectra fast and at a local spot in a skin tissue to get cancer margins without using the 532 nm RR.
This pilot study shows that VRR technology may have broad clinical applications for real-time, and label-free detection of skin lesions and other human tumors such as breast and brain[37-42,83,84]. A most recent reference to salient features of VRR in carotene in solution is given by Lu et al.[85].
Declarations
AcknowledgmentsThe authors are grateful to Dr. K. Sutkus for his assistance to manuscript preparation and submission.
Authors’ contributionsRead and revised the manuscript: All authors
Performed experiments, initiated the manuscript and performed data analysis: Liu CH
Performed the PCA-SVM analysis and wrote part of the manuscript: Wu B
Revised the manuscript: Sordillo LA
Performed experiments: Boydston-White S
Prepared the samples: Sriramoju V
Performed data analysis: Zhang C
Financially supported the study, participated in discussions and revised the manuscript: Beckman H
Participated in discussions and revised the manuscript: Zhang L, Pei Z, Shi LY
Is the principal investigator of the project, and supervised the entire study: Alfano RR
Availability of data and materialsThe data that support the findings of this study are available from the corresponding author upon reasonable request.
Financial support and sponsorshipThis preliminary work was supported in part by a seed grant from Sinai hospital of Detroit medical staff foundation.
Conflicts of interestAll authors declared that there are no conflicts of interest.
Ethical approval and consent to participateIn this study, the human skin normal and BCC specimens were obtained from the NDRI (Philadelphia, PA). The experimental procedures were approved by the City College of the City University of New York, IRB office.
Consent for publicationNot applicable.
Copyright© The Author(s) 2019.
REFERENCES
1. Rogers HW, Weinstock MA, Harris AR, Hinckley MR, Feldman SR, et al. Incidence estimate of nonmelanoma skin cancer in the united states. Arch Dermatol 2010;146:283-7.
2. Brewster DH, Bhatti LA, Inglis JHC, Nairn ER, Doherty VR. Recent trends in incidence of nonmelanoma skin cancers in the east of Scotland, 1992-2003. Brit J Dermatol 2007;156:1295-300.
3. American Cancer Society. Cancer Facts and Figures 2017. Available from: https://www.cancer.org/research/cancer-facts-statistics/all-cancer-facts-figures/cancer-facts-figures-2017.html. [Last accessed on 2 Jan 2019].
4. The Skin Cancer Foundation. Available from: https://www.skincancer.org/skin-cancer-information/skin-cancer-facts. [Last accessed on 9 Jan 2019].
5. Mogensen M, Jemec GBE. Diagnosis of nonmelanoma skin cancer/keratinocyte carcinoma: a review of diagnostic accuracy of nonmelanoma skin cancer diagnostic tests and technologies. Dermatol Surg 2007;33:1158-74.
7. Smith L, MacNeil S. State of the art in non-invasive imaging of cutaneous melanoma. Skin Res Technol 2011;17:257-69.
8. Kong K, Rowlands CJ, Varma S, Perkins W, Leach IH, et al. Diagnosis of tumors during tissue-conserving surgery with integrated autofluorescence and Raman scattering microscopy. Proc Natl Acad Sci U S A 2013;110:15189-94.
9. Heuke S, Vogler N, Meyer T, Akimov D, Kluschke F, et al. Detection and discrimination of non-melanoma skin cancer by multimodal imaging. Healthcare 2013;1:64-83.
10. Alfano RR, Tata D, Cordero J, Tomashefsky P, Longo FW, et al. Laser induced fluorescence spectroscopy from native cancerous and normal tissue. IEEE J Quantum Elect 1984;20:1507-11.
11. Alfano RR, Tang GC, Pradhan A, Lam W, Choy DSJ. Fluorescence spectra from cancerous and normal human breast and lung tissues. IEEE J Quantum Elect 1987;QE-23:1806-11.
12. Liu CH, Alfano RR, Sha WL, Zhu HR, Akins DL, et al. Human breast tissues studied by IR Fourier transform Raman spectroscopy. Lasers Life Sci 1991;4:23-8.
13. Liu CH, Sha Glasman WL, Zhu HR, Akins DL, Deckelbaum LI, et al. Near-IR Fourier transform Raman spectroscopy of normal and atherosclerotic human aorta. Laser in the Life Sciences 1992;43:257-64.
14. Brancaleon L, Durkin AJ, Tu JH, Menaker G, Fallon JD, et al. In vivo fluorescence spectroscopy of nonmelanoma skin cancer. Photochem Photobiol 2001;73:178-83.
15. Panjehpour M, Julius CE, Phan MN, Vo-Dinh T, Overholt S. Laser-induced fluorescence spectroscopy for in vivo diagnosis of non-melanoma skin cancers. Lasers Surg Med 2002;31:367-73.
16. Longo C, Rajadhyaksha M, Ragazzi M, Nehal K, Gardini S, et al. Evaluating ex vivo fluorescence confocal microscopy images of basal cell carcinomas in Mohs excised tissue. Br J Dermatol 2014;171:561-70.
17. Rao BK, Mateus R, Wassef C, Pelecinid G. In vivo confocal microscopy in clinical practice: comparison of bedside diagnostic accuracy of a trained physician and distant diagnosis of an expert reader. J Am Acad Dermatol 2013;69:e295-300.
18. Giambrone D, Alamgir M, Masud A, Bronsnick T, Rao B. The diagnostic accuracy of in vivo confocal microscopy in clinical practice. J Am Acid Dermal 2015;73:317-9.
19. Flores ES, Cordova M, Kose K, Phillips W, Rossi A, et al. Intraoperative imaging during Mohs surgery with reflectance confocal microscopy: initial clinical experience. J Biomed Opt 2015;20:61103.
20. Mosterd K, Krekels GA, Nieman FH, Ostertag JU, Essers BA, et al. Surgical excision versus Mohs’ micrographic surgery for primary and recurrent basal-cell carcinoma of the face: a prospective randomised controlled trial with 5-years’ follow-up. Lancet Oncol 2008;9:1149-56.
21. Choe CS, Lademann J, Darvin ME. Analysis of human and porcine skin in vivo/ex vivo for penetration of selected oils by confocal Raman microscopy. Skin Pharmacol Physiol 2015;28:318-30.
22. Kourkoumelis N, Balatsoukas I, Moulia V, Elka A, Gaitanis G, et al. Advances in the in vivo Raman spectroscopy of malignant skintumors using portable instrumentation. Int J Mol Sci 2015;16:14554-70.
23. Gniadecka M, Wulf HC, NieIseW OF, Christensen DH, Hercogova J. Distinctive molecular abnormalities in benign and malignant skin lesions: studies by Raman spectroscopy. Photochem Photobiol 1997;66:418-23.
24. Notingher I, Verrier S, Romanska H, Bishop AE, Polak JM, et al. In situ characterization of living cells by Raman spectroscopy. Spectroscopy 2002;16:43-51.
25. Sigurdsson S, Philipsen PA, Hansen LK, Larsen J, Gniadecka M, et al. Detection of skin cancer by classification of Raman spectra. IEEE Trans Biomed Eng 2004;51:1784-93.
26. Nijssen A, Bakker Schut TC, Heule F, Caspers PJ, Hayes DP, et al. Discriminating basal cell carcinoma from its surrounding tissue by Raman spectroscopy. J Invest Dermatol 2002;119:64-9.
27. Nunes LD, Martin AA, Silviera L, Zampieri M. FT-Raman spectroscopy study for skin cancer diagnosis. Spectrosc Int J 2003;17:602.
28. Choi J, Choo J, Chung H, Gweon DG, Park J, et al. Direct observation of spectral differences between normal and basal cell carcinoma (BCC) tissues using confocal Raman microscopy. Biopolymers 2005;77:264-72.
29. Nijssen A, Maquelin K, Santos LF, Caspers PJ, Bakker Schut TC, et al. Discriminating basal cell carcinoma from perilesinal skin using high wave-number Raman spectroscopy. J Biomed Opt 2007;12:034004.
30. Egawa M, Tagam H. Comparison of the depth profiles of water and water-binding substances in the stratum corneum determined in vivo by Raman spectroscopy between the cheek and volar forearm skin: effects of age, seasonal changes and artificial forced hydration. Br J Dermatol 2008;158:251-60.
31. Kumar S, Verma T, Mukherjee R, Ariese F, Somasundaramc K, et al. Raman and infrared microspectroscopy: towards quantitative evaluation for clinical research by ratiometric analysis. Chem Soc Rev 2016;45:1879-900.
32. Opitz CA, Litzenburger UM, Sahm F, Ott M, Tritschler I, et al. An endogenous tumour-promoting ligand of the human aryl hydrocarbon receptor. Nature 2011;478:197-203.
33. Waller JM, Maibach HI. Age and skin structure and function, a quantitative approach (I):blood flow, pH, thickness, and ultrasound echogenicity. Skin Res Technol 2005;11:221-35.
34. Ly E, Piot O, Durlach A, Bernard P, Manfait M. Polarized Raman microspectroscopy canreveal structural changes of peritumoral dermis in basal cell carcinoma. Applied Spectroscopy 2008;62:1088-94.
35. Caspers PJ, Lucasson GW, Carter EA, Bruining HA, Puppels GJ. In vivo confocal Raman microspectroscopy of the skin: noninvasive determination of molecular concentration profiles. J Invest Dermatol 2001;116:434-42.
36. Caspers PJ, Lucassen GW, Wolthuis R, Bruining HA, Puppels GJ. In vitro and in vivo Raman spectroscopy of human skin. Biospectroscopy 1998;4:S31-S9.
37. Zhou Y, Liu CH, Sun Y, Pu Y, Boydston-White S, et al. Human brain cancer studied by resonance Raman spectroscopy. J Biomed Opt 2012;17:116021.
38. Liu CH, Zhou Y, Sun Y, Li JY, Zhou LX, et al. Resonance Raman and Raman spectroscopy for breast cancer detection. Technol Cancer Res Treat 2013;12:371-82.
39. Zhou Y, Liu CH, Li JY, Zhou LX, Chen K, et al. Tumor margin detection using optical biopsy techniques. SPIE Proc 2014;8940:894014.
40. Zhou Y, Liu CH, Zhou LX, Zhu K, Liu YL, et al. Resonant Raman spectra of grades of human brain glioma tumors reveal the content of tryptophan by the 1588 cm-1 mode. Proc SPIE 2015;9318:931810.
41. Liu CH, Boydston-White S, Wang WB, Sordillo LA, Shi LY, et al. Optical pathology study of human abdominal aorta tissues using confocal micro resonance Raman spectroscopy. Proc SPIE 2016;9703:97031S.
42. Liu CH, Boydston-White S, Weisberg A, Wang W, Sordillo LA, et al. Vulnerable atherosclerotic plaque detection by resonance Raman spectroscopy. J Biomed Opt 2016;21:127006.
43. Liu CH, Sriramoju V, Boydston-White S, Wu B, Zhang C, et al. Resonance Raman of BCC and normal skin. Proc SPIE 2017;10060:100601B.
44. Massart DL, Vandeginste BGM, Deming SM, Michotte Y, Kaufman L. Chemometrics: a Textbook. Amsterdam: Elsevier; 1988.
46. Wu B, Nebylitsa SV, Mukherjee S, Jain M. Quantitative diagnosis of bladder cancer by morphometric analysis of HE images. Proc SPIE 2015;9303:930317.
47. Jain M, Robinson BD, Wu B, Khani F, Mukherjee S. Exploring multiphoton microscopy as a novel tool to differentiate chromophobe renal cell carcinoma from oncocytoma in fixed tissue sections. Arch Pathol Lab Med 2017; doi: 10.5858/arpa.2017-0056-OA.
48. Wu B, Mukherjee S, Jain M. A new method using multiphoton imaging and morphometric analysis for differentiating chromophobe renal cell carcinoma and oncocytoma kidney tumors. Proc SPIE 2016;9712:97121O.
49. Mazet V, Carteret C, Brie D, Idier J, Humbert B. Background removal from spectra by designing and minimising a non-quadratic cost function. Chemometr Intell Lab Syst 2005;76:121-33.
50. Jolliffe IT. Principal Component Analysis. New York: Springer; 1986.
52. Wu B, Alrubaiee M, Cai W, Xu M, Gayen SK. Diffuse optical Imaging using decomposition methods. Int J Opt 2012;2012:185435.
53. Golub GH, Reinsch C. Singular value decomposition and least squares solutions. Numer Math 1970;14:403-20.
55. Zweig MH, Campbell G. Receiver-operating characteristic (ROC) plots: a fundamental evaluation tool in clinical medicine. Clin Chem 1993;39:561-77.
56. Platt JC. Probabilistic outputs for support vector machines and comparisons to regularized likelihood methods. Advances in Large Margin Classifiers. Cambridge, MA: MIT Press; 1999. pp. 61-74.
57. Hanley JA, McNeil BJ. The meaning and use of the area under a receiver operating characteristic (ROC) Curve. Radiology 1982;143:29-36.
58. Leeflang MMG, Moons KGM, Reitsma JB, Zwinderman AH. Bias in sensitivity and specificity caused by data-driven selection of optimal cutoff values: mechanisms, magnitude, and solutions. Clin Chem 2008;54:729-37.
59. Hata TR, Scholz TA, Ermakov IV, McClane RW, Khachik F, et al. Non-invasive Raman spectroscopic detection of carotenoids in human skin. J Invest Dermatol 2000;115:441-8.
60. Skin Cancer Treatment (PDQ®)-Patient Version. Available from: https://www.cancer.gov/types/skin/patient/skin-treatment-pdq. [Last accessed on 4 Jan 2019].
61. Sandby-Møller J, Poulsen T, Wulf HC. Epidermal thickness at different body sites: relationship to age, gender, pigmentation, blood content, skin type and smoking habits. Acta Derm Venereol 2003;83:410.
62. Ermakov IV, Sharifzadeh M, Ermakova M, Gellermann W. Resonance Raman detection of carotenoid antioxidants in living human tissue. J Biomed Opt 2005;10:064028.
63. Ermakov IV, Whigham LD, Redelfs AH, Jahns L, Stookey J, et al. Skin carotenoids as biomarker for vegetable and fruit intake: validation of the reflection-spectroscopy based “Veggie Meter”. FASEB J 2016;30:409.
64. Ermakov IV, Ermakova MR, Gellermann W, Lademann J. Noninvasive selective detection of lycopene and beta-carotene in human skin using Raman spectroscopy. J Biomed Opt 2004;9:332-8.
65. Mayne ST, Cartmel B, Scarmo S, Jahns L, Ermakov IV, et al. Resonance Raman spectroscopic evaluation of skin carotenoids as a biomarker of carotenoid status for human studies. Arch Biochem Biophys 2013;539:1-18.
66. Ren H, Biggs JD, Mukamel S. Two-dimensional stimulated ultraviolet resonance Raman spectra of tyrosine and tryptophan; a simulation study. J Raman Spectrosc 2013;44:544-59.
67. Darvin ME, Sterry W, Lademann J, Vergou T. The role of carotenoids in human skin. Molecules 2011;16:10491.
68. Haag SF, Taskoparan B, Darvin ME, Groth N, Lademann J, et al. Determination of the antioxidative capacity of the skin in vivo using resonance Raman and electron paramagnetic resonance spectroscopy. Exp Dermatol 2011;20:483-7.
69. Lademann J, Meinke MC, Sterry W, Darvin ME. Carotenoids in human skin. Exp Dermatol 2011;20:377-82.
70. Wrona M, Korytowski W, Rozanowska M, Sarna T, Truscott TG. Cooperation of antioxidants in protection against photosensitized oxidation. Free Radic Biol Med 2003;35:1319-29.
71. Palozza P, Krinsky NI. beta-Carotene and alpha-tocopherol are synergistic antioxidants. Arch Biochem Biophys 1992;297:184-7.
72. Darvin ME, Sterry W, Lademann J. Resonance Raman spectroscopy as an effective tool for the determination of antioxidative stability of cosmetic formulations. Journal of Biophotonics 2010;3:82-8.
73. Puppels GJ, Schut TCB, Sijtsema NM, Grond M, Maraboeuf F, et al. Development and Application of Raman microspectroscopic and Raman imaging techniques for cell biological studies. Journal of Molecular Structure 1995;347:477-84.
75. Moroni F. Tryptophan metabolism and brain function: focus on kynurenine and other indole metabolites. European Journal of Pharmacology 1999;375:87-100.
76. Fatokun AA, Hunt NH, Ball HJ. Indoleamine 2,3-dioxygenase 2 (IDO2) and the kynurenine pathway: characteristics and potential roles in health and disease. Amino Acids 2013;45:1319-29.
77. Sordillo PP, Sordillo LA, Helson L. The kynurenine pathway: a primary resistance mechanism in patients with glioblastoma. Anticancer Research 2017;37:2159-71.
78. Shafaat HS, Kim JE. Resonance Raman analysis of the tryptophan cation radical. J Phys Chem Lett 2014;5:3009-14.
79. Shafaat HS, Leigh BS, Tauber MJ, Kim JE. Resonance Raman characterization of a stable tryptophan radical in an azurin mutant. J Phys Chem B 2009;113:382-8.
80. Bleifuss G, Kolberg M, Pötsch S, Hofbauer W, Bittl R, et al. Tryptophan and tyrosine radicals in ribonucleotide reductase: a comparative high-field EPR study at 94 GHz. Biochemistry 2001;40:15362-8.
81. Pandey R, Paidi SK, Kang JW, Spegazzini N. Discerning the differential molecular pathology of proliferative middle ear lesions using Raman spectroscopy. Scientific Reports 2015;5:13305.
82. Bodanese B, Silveira LJ, Albertini R, Zangaro RA, Pacheco MTT. Differentiating normal and basal cell carcinoma human skin tissues in vitro using dispersive Raman spectroscopy: a comparison between principal components analysis and simplified biochemical models. Photomed Laser Surg 2010;28:S119-S27.
83. Jermyn M, Mok K, Mercier J, Desroches J, Pichette J, et al. Intraoperative brain cancer detection with Raman spectroscopy in humans. Sci Transl Med 2015;7:274ra19.
84. Bergholt MS, Zheng W, Ho KY, Teh M, Yeoh KG, et al. Fiberoptic confocal raman spectroscopy for real-time in vivo diagnosis of dysplasia in Barrett’s esophagus. Gastroenterology 2014;146:27-32.
Cite This Article
Export citation file: BibTeX | RIS
OAE Style
Liu Ch, Wu B, Sordillo LA, Boydston-White S, Sriramoju V, Zhang C, Beckman H, Zhang L, Pei Z, Shi L, Alfano RR. A pilot study for distinguishing basal cell carcinoma from normal human skin tissues using visible resonance Raman spectroscopy. J Cancer Metastasis Treat 2019;5:4. http://dx.doi.org/10.20517/2394-4722.2018.55
AMA Style
Liu Ch, Wu B, Sordillo LA, Boydston-White S, Sriramoju V, Zhang C, Beckman H, Zhang L, Pei Z, Shi L, Alfano RR. A pilot study for distinguishing basal cell carcinoma from normal human skin tissues using visible resonance Raman spectroscopy. Journal of Cancer Metastasis and Treatment. 2019; 5: 4. http://dx.doi.org/10.20517/2394-4722.2018.55
Chicago/Turabian Style
Liu, Cheng-hui, Binlin Wu, Laura A. Sordillo, Susie Boydston-White, Vidyasagar Sriramoju, Chunyuan Zhang, Hugh Beckman, Lin Zhang, Zhe Pei, Lingyan Shi, Robert R. Alfano. 2019. "A pilot study for distinguishing basal cell carcinoma from normal human skin tissues using visible resonance Raman spectroscopy" Journal of Cancer Metastasis and Treatment. 5: 4. http://dx.doi.org/10.20517/2394-4722.2018.55
ACS Style
Liu, C.h.; Wu B.; Sordillo LA.; Boydston-White S.; Sriramoju V.; Zhang C.; Beckman H.; Zhang L.; Pei Z.; Shi L.; Alfano RR. A pilot study for distinguishing basal cell carcinoma from normal human skin tissues using visible resonance Raman spectroscopy. J. Cancer. Metastasis. Treat. 2019, 5, 4. http://dx.doi.org/10.20517/2394-4722.2018.55
About This Article
Special Issue
Copyright

Data & Comments
Data


 Cite This Article 17 clicks

 Like This Article 19
likes
Like This Article 19
likes


Comments
Comments must be written in English. Spam, offensive content, impersonation, and private information will not be permitted. If any comment is reported and identified as inappropriate content by OAE staff, the comment will be removed without notice. If you have any queries or need any help, please contact us at support@oaepublish.com.