
Magnetic nanotechnologies for early cancer diagnostics with liquid biopsies: a review

Abstract
Liquid biopsy has become an emerging technology in the detection of cancer related biomarkers as well as the continuous monitoring of cancer treatment. There has been extensive research on the applications of magnetic nanotechnologies in liquid biopsies from the separation of target analytes to the detection of cancer biomarkers. Magnetic separation plays an important role in increasing both the efficiency and sensitivity of the liquid biopsy process. The detection of cancer biomarkers through magnetic nanosensors also possesses many advantages such as low background noise, high sensitivity, short assay time, and the ability to detect multiple biomarkers at the same time. This review focuses on the recent advances of magnetic nanotechnologies in liquid biopsies for cancer detection and its future potential in comparison with other technologies.
Keywords
Introduction
Liquid biopsy is a new diagnostic concept that has received much attention in the past few years. It was originally defined as “the test on the blood sample of the patient to study the circulating tumor cells or cell free DNA derived from the tumor cells in the blood” by the National Cancer Institute[1]. Compared to the conventional invasive biopsy that contains cells or tissues from lesion, liquid biopsy is a noninvasive technique whose target analytes include circulating tumor cells (CTCs), circulating tumor DNA (ctDNA) and RNA (ctRNA), and exosomes[2-4]. To date, liquid biopsy has been performed in various biological fluids including peripheral blood, urine, ascites, pleural effusion, etc. for early diagnosis, screening, prognosis assessment, detection of minimal residual disease, and the design of personalized treatment for cancer therapy[3,5]. The target biomarkers are firstly separated and enriched via a variety of separation technologies, followed by the determination of the biomarker concentration using different biosensor platforms. Many novel nanotechnologies have been developed in the liquid biopsy field. Loeian et al.[6] fabricated a nanotube-CTC chip with the ability to selectively capture CTCs in the blood sample. It was shown that this nanotube-based device can successfully capture CTCs from the peripheral blood of breast cancer patients with a range of 0.5-28 CTCs per mL[6]. Yu et al.[7] developed a fluorescent probe that can release the outmost antibodies after binding with CTCs, making it possible to release and recycle CTCs in future liquid biopsy processes[7]. Besides the separation and detection of CTCs, a polymerase chain reaction (PCR) approach was proposed for the detection of ctDNA by using a quencher-free fluorescent probe DNA and graphene oxides. This method can detect as low as 49 pg of epidermal growth factor receptor (EGFR) exon 19 detection DNA with a detection limit of 0.1%[8]. A comprehensive review on the current liquid biopsy technologies is contributed by Tang et al.[9].
Of all the proposed technologies for liquid biopsy, magnetic nanotechnologies stand out for the ease in cell manipulation under magnetic field during biomarker separation[10-12], as well as low background noise and high theoretical sensitivity during biomarker detection due to the fact that most of the biological environment is non-magnetic. However, as with other types of biosensors, the sensitivity of the magnetic biosensors also depends on the system setup, the surface biofunctionalization processes, and the intrinsic sensitivity of the sensing segment. In this review, magnetic separation technologies using high-moment magnetic nanoparticles (MNPs) as tags are introduced. Microfluidic channels are reviewed in the following section regarding their crucial role in both magnetic separation and magnetic sensing. Finally, two types of magnetic nanotechnologies for liquid biopsy are introduced: magnetoresistance (MR) sensors as a surface-based liquid biopsy technology and nuclear magnetic resonance (NMR) as a volume-based liquid biopsy technology.
Magnetic separation
The majority of cell-based liquid biopsy research has been focused on the detection of CTCs since it is the major cause of death and can be detected by non-invasive techniques from patients’ blood samples[13]. However, due to the low abundance of CTCs, cell sorting or cell separation is required prior to the detection process. To date, various devices have been developed to separate the CTCs from other undesired background substances. Cell size-based separation is a label-free technique that sorts the target cells out according to their unique properties such as size and stiffness[14,15]. Alternatively, specific binding-based separation captures the target cells on patterned surfaces through chemical/immunoassays. While cell size-based devices exhibit high throughput and label-free characteristics, the specificity of the capture is often sacrificed due to the variation of the size and stiffness of the CTCs. On the other hand, techniques based on binding cells to certain surfaces show higher specificity, but suffer from low throughput and difficulties in cell recycling[12,16-18]. Magnetic separation falls into the category of specific binding-based technologies. However, instead of binding the target cells to surfaces, MNPs are employed to mark the target cells, which are captured onto magnetized surfaces subsequently. Unlike the aforementioned techniques, the captured cells can be released easily by removing the magnetic field. In this section, high-moment MNPs are introduced first as an important approach to increase the capture efficiency. Optimization of the capture process from both surface functionalization and device configuration aspects is also summarized.
High-moment magnetic nanoparticles
MNPs have been widely used as biomarkers for biosensing and could also be used to mark the CTCs for liquid biopsy. By labeling CTCs using MNPs, these CTCs can be separated by applying an external magnetic field. The migration velocity of a MNP under the application of a homogeneous magnetic field, i.e. the magnetophoresis process, largely depends on the magnetic moments of the MNPs. Bruus et al.[18] theoretically calculated the magnetophoretic force acting on a spherical particle in non-homogeneous field. It is given by equation:
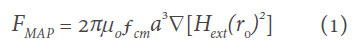
where ∇Hext is the gradient of the external magnetic field, the diameter of the particle is represented by a, and fCM is the Clausius-Mossotti factor of magnetization (CM). fCM is represented as: (μ - μ0)/(μ + 2μ0). Here, μ and μ0 are the magnetic permeabilities of the spherical particle and vacuum, respectively.
Iron oxide MNPs, such as γ-Fe2O3 and Fe3O4, are widely used in the biosensing area due to their good stability and biocompatibility. However, the saturation magnetization of iron oxide MNPs is around three times smaller than that of high-moment MNPs such as Fe, FeCo, Fe16N2, etc.[19,20]. These high-moment MNPs can provide much higher magnetic forces and, as a result, enhance the capture efficiency and reduce the dose of MNPs needed for liquid biopsy. Many research groups have reported the synthesis of high-moment MNPs. Generally, two approaches are used to synthesis high-moment MNPs: the bottom-up approach and the top-down approach. For the bottom-up approach, MNPs are formed from atoms that nucleate and grow into nanoparticles. For example, a gas-phase condensation (GPC) method is used to obtain these atoms either by thermal evaporation or sputtering. By cooling down these atoms, nucleation starts and then the nuclei grow into nanoparticles of various shapes. High-moment MNPs such as Fe, and FeCo have been successfully synthesized using this GPC method[21,22]. In addition, high-moment MNPs with biocompatible shells such as SiO2, Ag, and Au can also be synthesized by the GPC method. FeCo MNPs are also reported by using a wet chemistry method[23], which also belongs to the bottom-up approach. In contrast, for the top-down approach, MNPs are made from raw bulk materials that are broken down to small nanoparticles, such as the ball milling method. Chakka et al.[24] successfully prepared Fe, Co, and FeCo MNPs by using a surfactant-assisted ball milling method, and the size of these MNPs can be smaller than 10 nm. These high-moment MNPs are promising candidates for liquid biopsy.
Magnetic separation in liquid biopsy
Besides the search for novel materials and synthesis techniques to develop high-moment MNPs, surface functionalization strategies also play an important role in the cell-particle interactions, which can greatly impact the capture efficiency and specificity. The most commonly used technique to conjugate MNPs to the target cells is by functionalizing antibodies on MNP surfaces that can bind specifically to the antigens on the target cells[25,26]. However, extra surface coating is required to further enhance both the efficiency and the specificity of the cell capture process. A good example would be the biomimetic cell-membrane-camouflaged nanoparticles. Rao et al.[27] coated platelet (PLT)-leukocyte (WBC) hybrid membranes followed by the modification of antibodies [Figure 1]. They showed that the PLT membranes can recognize and communicate with CTCs, thus enhancing the binding efficiency. On the other hand, the WBC coatings can reduce the interactions between the MNPs and the white blood cells in the background. Combining the characteristics of both coatings, the hybrid membrane-coated immunomagnetic beads exhibited an improvement of capture efficiency from 66.68% (commercial product) to 91.77% with an increase in cell purity, too.
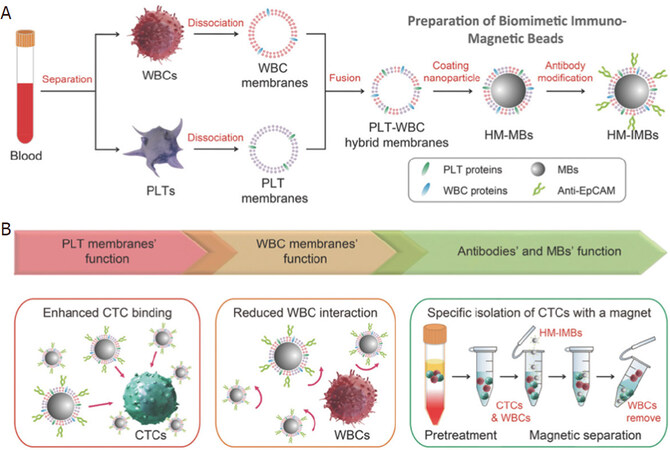
Figure 1. Schematic of the preparation process for the hybrid membrane-coated immunomagnetic particles (A) and the function of PLT and WBC membranes (B)[27] (reprinted with permission from John Wiley and Sons). PLT: platelet; WBC: leukocyte
In addition to the optimization of MNPs, much attention has been paid to developing novel cell separation devices. In magnetic separation, the device performance largely depends on the strength and spatial distribution of the magnetic field. Traditional magnetic separation utilizes permanent magnets that are in the size range of several millimeters to centimeters, which suffers from small magnetic field gradient, low density of magnetic traps, and poor control over the magnetic field profile. To increase the capture efficiency, especially for rare cell separation, magnetic structures with micro- or nanometer sizes are proposed. Chen et al.[25] fabricated micromagnet arrays with the inkjet printing technology. In this work, the MNPs were firstly mixed with the printing ink and then printed with predefined pattern on the glass slide. After the evaporation of the liquid printing ink by heating, the MNPs self-assembled into a micromagnet structure. A permanent magnet was placed under the printed micromagnets to generate the magnetic field for long-range capture and magnetize the micromagnets for short-range trapping of the CTCs. It was found that the printed micromagnets led to a 26% increase in the capture efficiency. Besides the inkjet-printed magnets, a microfabricated magnetic sifter was proposed by Earhart et al.[28]. A silicon wafer was patterned with hexagonal arrays of 40-μm holes with permalloy coatings. The blood sample was firstly labeled with magnetic tags and then pumped through the hexagonal holes under an external magnetic field. Due to the high magnetic gradient at the edge of the holes, the magnetically labeled target cells were captured while the unlabeled cells passed through the holes. A capture efficiency of 90% was reported for high epithelial cell adhesion molecule (EpCAM) expressing cells.
Microfluidic channels
The integration with microfluidic channels has become a “common sense” during the process of designing novel liquid biopsy platforms to facilitate highly efficient cell separation, to reduce the biomaterial consumption, to minimize the detection time, and to increase the density of functional devices. In this section, the fabrication process of microfluidic channels is reviewed, followed by their application in magnetic separation. Microfluidic channels can also be integrated with magnetic sensors during liquid biopsy. However, since microfluidic channels are usually not the core of discussion in most magnetic sensing applications, they are reviewed together with magnetic sensors in Section 4.
Fabrication of microfluidic channels
Poly(dimethylsiloxane) (PDMS) is the most commonly employed material in the fabrication of the microfluidic channels since it is low-cost, chemically inert under most circumstances, nontoxic, and compatible with lithography processes[29]. Conventional 2D microfluidic channels can be made by a soft lithography process. A master mold is firstly fabricated by photolithography, followed by the curing of PDMS on it. Due to the low surface free energy and elasticity, the cured PDMS can replicate the shape of the master mold and be released without causing any damage. Both reversible and irreversible sealing can be realized between PDMS and the channel substrate[30]. Reversible sealing can be achieved either by applying a pressure greater than 5 psi or through adhesive tapes, while irreversible sealing can be formed by plasma treatment of the contact surface[31]. Despite the straight-forward fabrication processes, many challenges exist for the PDMS microfluidic channels based on soft lithography, such as flow profile problems due to leakage and uneven pressure, low fabrication efficiency, and poor flexibility due to the need of fabricating the master molds.
There has been much progress in developing both novel materials and fabrication technologies for the microfluidic channels[32,33]. The ability to manufacture 3D structures and the additive nature of the process have made 3D printing a promising candidate in the fabrication of microfluidic channels. A polyjet-based 3D printed fluidic device was developed by Gross et al.[34]. The device design was completed with the aid of computer-aided software and then converted to a STL file prior to printing. A rigid and transparent channel was developed with precise control of the channel dimension (1 mm × 0.8 mm × 2 mm). Besides 3D printing, other techniques have also been explored to fabricate 3D microfluidic channels. Song et al.[35] proposed a metal wire removal process, where a thin soldering wire with a 3D circular shape was employed. After pouring PDMS onto the metal wire and curing it, the metal wire was melted out via heating. With this simple process, circular, helix-shaped, and double helix-shaped microfluidic channels can be easily prepared. In another work, a direct laser writing approach was used to prepare microfluidic channels embedded in fused silica with an aspect ratio over 1000[36]. Direct laser writing usually results in high surface roughness. In this work, wet etching and glass drawing process were conducted after the laser writing, which significantly reduced the surface roughness from 50.3 nm to 0.29 nm.
Microfluidic channels in magnetic separation
The design of microfluidic channels play an important role in optimizing the efficiency of magnetic separation. Inglis et al.[37] fabricated a device with ferromagnetic Ni strips underneath the separation chamber at angle of 10° to the bottom of the continuous flow [Figure 2A]. When an external magnetic field is applied, the flux lines are concentrated on the Ni strips. Magnetically labeled cells [in this case, the white blood cells (WBCs)] deviate away from the flow direction and move along the direction of the strips. In this way, they achieved separation of WBCs from red blood cells (RBCs). In another technique, Hans and Frazier applied a uniform magnetic field normal to the ferromagnetic Ni wires which was fabricated along the length of the microfluidic channel[38]. They magnetically deformed the ferromagnetic wire using high magnetic field gradient, which generates the magnetic field gradient. By playing around with the direction of the magnetic field, they got the fabricated device to work in “diamagnetic capture mode” and “paramagnetic capture mode” that very efficiently separated the diamagnetic WBCs, cells and tissues, and the paramagnetic deoxy-hemoglobin RBCs.
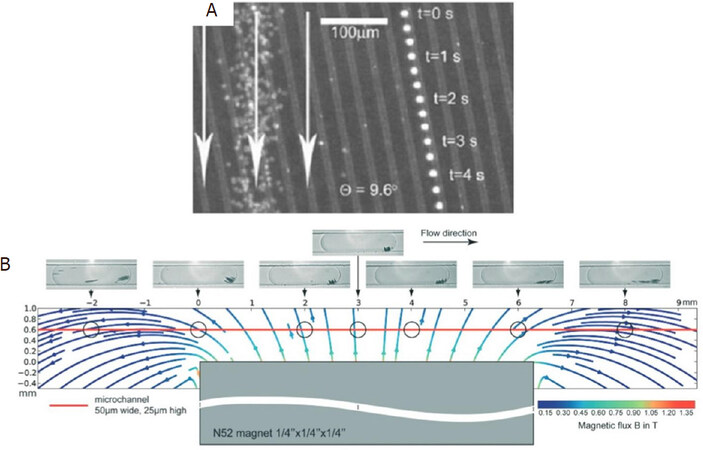
Figure 2. Schematic design of a Ni wire that can be operated in diamagnetic and paramagnetic mode for the separation of diamagnetic WBCs, cells, and tissues from paramagnetic deoxy-hemoglobin RBCs (A)[37] (reprinted with permission from AIP Publishing); Schematic overview of the droplet based magnetic bead separation from a microfluidic channel (B)[40] (reprinted with permission from Royal Society of Chemistry). WBC: leukocyte; RBC: red blood cell
Afshar et al.[39] designed a system to meet the requirements of specific bioassays to study the on-chip agglutination assays for the detection of rare analytes by particle coupling as doublets. They integrated the PDMS microfluidic channels with soft magnetic microtips of varied shapes and sizes to provide the magnetic field gradient for the particles. The magnetic tips serve as the field concentrators and are positioned in the near vicinity of the microfluidic channel to generate even higher magnetic actuation forces. This device was experimentally tested to achieve three goals with two sets of superparamagnetic particles of sizes 1 μm and 2.8 μm: (1) dosing and immobilization of desired number of magnetic beads; (2) targeted release of the beads in a highly confined particle stream; and (3) continuous magnetophoretic size separation in-flow with high resolution.
Brouzes et al.[40] reported a droplet-based microfluidic method to separate desired molecules in a rapid and, most importantly, continuous fashion. They accomplished this by at first marginalizing functionalized superparamagnetic beads within the droplet using magnetic field and then splitting the same droplet with one containing the majority of magnetic beads and the other containing the minority part. They quantitatively and qualitatively analyzed the factors which affect the marginalization and the splitting of the droplet. Furthermore, they studied how the marginalization affects the droplet velocity. Figure 2B shows the MNP distribution and orientation as a function of position with respect to the magnet. Most of the MNPs aggregate towards the center of the magnet. However, the aggregation is not exactly at the center of the magnet because of the internal magnetic field flow lines. Finally, they correctly assessed that this droplet-based technique is well-suited for applications in single cell genomics and proteomics. As a foresight, they claimed that this method could also be used to separate mRNA bound to poly-dT functionalized MNPs from single cell lysates to prepare cDNA cell microarrays.
Weddemann et al.[41] reported theoretical calculations supported by experiments for the separation of several particles based on size using the combined hydrodynamic and magnetophoretic forces. Jung et al.[42] designed another such device with slanted ridge arrays in a microfluidic channel. This kind of configuration was reported to have a larger magnetophoretic force of 7.68 μN in comparison to 0.35 pN from the traditional devices. With this design of microfluidic channels, 91.68% ± 2.18% of the E. coli bacterial cells labeled with MNPs were separated from undiluted whole blood sample at a rate of 0.6 mL/h. This is a significant improvement when compared to conventional devices where only 23.98% ± 6.59% of E. coli could be separated.
Of the other works on using microfluidics for magnetic separation, Hou et al.[43] reported the detection of Salmonella from spiked milk using microfluidic signal off strategy to monitor changes in electrical signal. This strategy helped in amplification of biological signals and the limit of detection (LOD) of the Salmonella was reported to be 33 CFU/mL with as assay time of 2 h. Although it was not a rapid procedure, the LOD seems promising. The schematic setup for their detection of Salmonella is shown in Figure 3A. The mixture models for bio-magnetic separation using microfluidics were demonstrated by Khashan et al.[44]. Wu et al.[45] reported size selective separation of magnetic microspheres using microfluidic channels. Their experimental results were corroborated with numerical simulations. Oh et al.[46] modified the tip of a micropipette with Ni wire meshes and demonstrated magnetic activated cell sorting (MACS) [Figure 3B]. This facilitated high throughput and gradient magnetic separation by simple pipetting procedure, thereby leading to high rate of separation of bacteria from whole blood in addition to successful bacterial culture and analysis of the sorted bacteria without off-tip processing. Gao et al.[47] reported a novel wash-free magnetic immunoassay technique for prostate specific antigen (PSA) that employs a surface enhanced Raman scattering-based microdroplet sensor (SERS) for readout [Figure 3C]. A wash-free approach was demonstrated to detect PSA antigens with a reported LOD of 0.1 ng/mL.
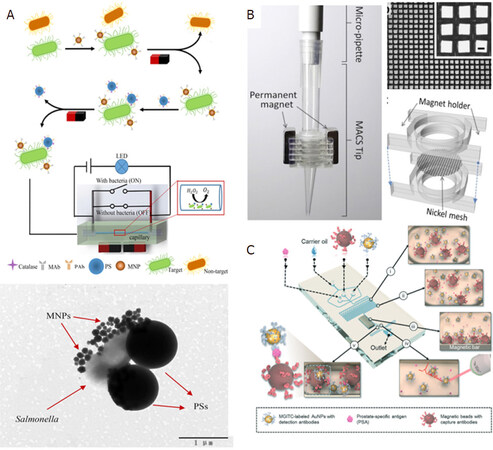
Figure 3. Schematic set-up for the microfluidic channel based immunomagnetic separation including enzyme catalysis and electrical signal-off for detection of Salmonella (A)[43] (reprinted with permission from Elsevier); MACS tip for immunomagnetic separation consisting of rectangular Ni meshes and permanent neodymium magnets on both sides of the Ni mesh (B)[46] (reprinted with permission from Elsevier); schematic microfluidic channel design for the wash-free magnetic immunoassay for PSA using SERS droplet-based sensor for readout (C)[47] (reprinted with permission from Royal Society of Chemistry). MACS: magnetic activated cell sorting; PSA: prostate specific antigen; SERS: surface enhanced Raman scattering
MR sensors
MR biosensors have been studied for the past 30 years as a sensitive surface-based detection approach. During the detection process, the target analytes are captured by MNPs, which can subsequently bind to the sensor surface through the corresponding antibodies or complementary DNAs functionalized on the surface, resulting in a capture antibody-antigen-detection antibody-MNP complex or a probe DNA-target DNA-MNP complex. The surface functionalization technologies for both antibody-antigen as well as DNA-based magnetic assays are comprehensively[48]. Under an external magnetic field, the MNP tags can generate stray fields, which will result in the resistance change of the MR sensors. Since the sensor signal is proportional to the number of MNPs in proximity to its surface, higher analyte concentrations will result in higher sensor signals. MR sensors possess multiple advantages as compared to other biosensing techniques. Detection based on magnetic field results in low background noise as most biological samples are paramagnetic, diamagnetic, or nonmagnetic. The sensor signals are also less affected by the chemical environment of the sample, such as pH and temperature[49]. With the development of nanofabrication technologies, MR sensors can also be integrated into high-density chips, which makes it possible to realize multiplexed detection as well as the development of point-of-care (POC) detection with minimized device size[50,51]. In this section, magnetoresistance effect are firstly introduced from a fundamental viewpoint, followed by the surface functionalization strategies and some examples of MR sensors’ application in liquid biopsy. The integration of MR sensors with POC devices is also reviewed.
Magnetoresistance
Three different MR effects have been applied to the field of biosensors. Anisotropic magnetoresistance (AMR) refers to the phenomenon where the electrical conductivity of a spontaneously magnetized materials depends on the relative orientation of the electrical current and the magnetization. Since it was first discovered in Ni and Fe in 1857, the physical origin of the AMR effect has been extensively studied and was found to originate from the anisotropic scattering of electrons due to the spin-orbital coupling[52], which was firstly described in the two-current model[53]. Although AMR is one of the earliest discoveries in the family of MR effects, the AMR ratio in most material systems are relatively low, which limited the signal from AMR devices until the discovery of the giant magnetoresistance (GMR)effect[54,55]. Nevertheless, AMR sensors still possess many advantages such as high sensitivity to the angle between magnetic field and the current direction (application in angular sensors), lower cost, and simple material system.
As opposed to the simple ferromagnetic films in AMR devices, GMR and tunneling magnetoresistance (TMR) exist in multilayer stacks[56,57]. In a stack with alternating ferromagnetic layers and spacers, the magnetization orientation in the ferromagnetic layers can be altered by an external magnetic field. The electrical resistance of the structure increases when the magnetizations are parallel in adjacent ferromagnetic layers and decreases when the magnetizations are antiparallel. GMR and TMR occur when the spacer is a conductive metal layer and an insulating layer, respectively. TMR and GMR stacks possess much higher MR ratio than AMR sensors, which makes them better candidates for the sensing applications where the sensor signal and sensitivity are the top priorities[58,59]. Compared to GMR sensors, TMR sensors generally exhibit higher MR ratio, which results in higher sensor signals as well as sensitivity. However, TMR sensors also suffer from poor linearity and larger noise. Furthermore, the complexity in TMR device fabrication as well as the need of top electrodes also induces difficulties in the design of TMR biosensors. Both GMR and TMR sensors’ application in liquid biopsies are reviewed in Section 4.2.
MR sensors for liquid biopsy
Immunoassay-based liquid biopsy
The elevated or reduced concentration of protein biomarkers in blood, saliva, or tissue can serve as indicators of cancer status[60]. Since single biomarker detection can lead to false positive or false negative cases, multiplexed detection systems are required to achieve specific and sensitive cancer diagnosis, which can be achieved in MR sensors. During multiplexed detection, densely packed MR sensors are fabricated on a single chip with simultaneous signal readout. The sensors can be divided into different groups which are functionalized with different capture antibodies that are specific to various biomarkers. Klein et al.[61] developed a multiplexed GMR sensing system that can detect three ovarian cancer biomarkers at the same time. The detection limit for cancer antigen 125 (CA125 II), human epididymis protein 4 (HE4), and interleukin 6 (IL6) are 3.7 U/mL, 7.4 pg/mL, and 7.4 pg/mL, respectively [Figure 4]. Another GMR sensing system reported by Gao et al.[62] shows the capability of detecting 12 tumor biomarkers at the same time in only 15 min. It was shown that the analytical sensitivity was either comparable or better than the commercially available single-analyte immunoassays. Besides the aforementioned work, various kinds of biomarkers have been validated in the GMR sensor system such as urinary endoglin for prostate cancer[63], eotaxin, and tumor necrosis factor alpha[64]. Recently, Zhu et al.[65] proposed to replace the traditional MNPs with 2D MoS2-Fe3O4 nanostructures (MOFE). With the addition of layered MoS2 materials, the loading density of MNPs are increased, resulting in higher sensor signal. With the integration of the MOFE probes, the GMR system was capable of detecting as few as 100 exomes.
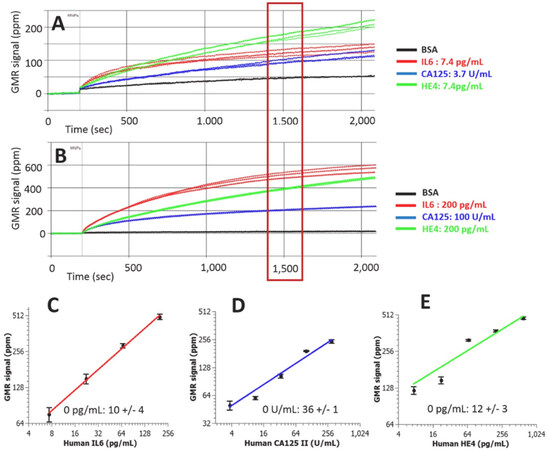
Figure 4. Real-time GMR sensor for multiplexed detection of the biomarkers (A,B); Calibration curves of multiplexed IL6, CA125 II, and Human HE4 assays (C-E)[61] (reprinted with permission from Elsevier). GMR: giant magnetoresistance; IL6: interleukin 6; CA125: cancer antigen 125; HE4: epididymis protein 4
Besides GMR sensing platforms, magnetic tunneling junction (MTJ) sensors have also been demonstrated as a proof-of-concept for the detection of liver cancer biomarkers[66]. The CoFeB/MgO/CoFeB MTJ exhibited a MR ratio of 122% and a sensitivity of 0.95%/Oe at room temperature. Three concentrations of alpha-fetoprotein were successfully detected. However, there has not been any further research in multiplexed cancer biomarker detection with MTJ sensors to the authors’ best knowledge. The lack of experimental results for MTJ-based liquid biopsies can be attributed to the following reasons: (1) the complex stack structures of MTJs can result in large variations of performance between different MTJ devices, making it hard to generate calibration curves for different biomarkers; (2) the top electrodes of the MTJs tend to increase the distance between the sensor and the magnetic tags, leading to a decrease in sensor signal; and (3) it is hard to realize linear transfer curves in MTJ sensors, which further complicates the process of correlating sensor signal to the analyte concentrations.
DNA-based liquid biopsy
Besides antibody-antigen-based liquid biopsy, DNA is another important analyte for cancer detection. The ability of DNA detection has been demonstrated for both MTJ and GMR sensors. A proof-of-concept detection of DNA was achieved in a MTJ sensor with a Al2O3 barrier[67]. Later, a quantitative detection of DNA was achieved by integrating 64 MgO MTJs on a single chip. However, there was not much work on MTJ-based DNA detection related to cancer detection. On the contrary, GMR sensors have been extensively studied as potential candidates for DNA-based liquid biopsies. Nesvet et al.[68] reported the integration of methylation specific PCR to melting curve analysis on GMR sensors to enhance the sensitivity for methylation detection. By measuring the difference of melting point between the DNA probes that targeted on methylated or unmethylated cytosineguanine dinucleotides (CpG) sites, the system was able to detect the methylated DNA with an analytical LOD down to 0.1%. It was also shown by the same group that this melting curve approach can simultaneously profile five mutation and four methylation sites in human melanoma cell lines[69]. The detection of cell-free (cfDNA) was demonstrated by Dias et al.[70]. The capture DNA probes were firstly spotted manually on the GMR chip, followed by the integration of a microfluidic channel. The magnetically labeled target DNA fragments (ALU115 and ALU247) was then introduced to the sensor surface through the microfluidic channel. A detection limit of picomolar range was achieved upon optimization.
POC devices
Ever since the discovery of MR sensors as a potential biosensor, MR-based POC devices have had a very exciting past showing a very promising future. Nevertheless, this topic has been subjected to extensive reviews[48,71,72]. There have been two decades of research on improving the sensitivity of the GMR sensor, which was inevitably followed by untiring attempts from several groups worldwide to develop GMR-based POC devices that have proved extremely successful in rapid detection of multivariate pathogens. A research group from Stanford University has developed a device, named Eigen Lifescience, along with a customized App, all fit in the size of a smartphone. This smartphone-shaped device operating on the basis of GMR-based biosensor has been reported to be capable of diagnosing several harmful pathogens such as Hepatitis B virus[73] and detecting DNA hypermethylation from melanoma cancer cells[68] as well as prostate cancer antigen[74], protein signatures in mouse lymphoma[75], HIV and leukocytosis[76], RNA sequencing[77], and lung cancer[78]. A research group from the University of Minnesota has developed another handheld device for GMR-based biosensing that has been commercialized. The device, better known as Z-Lab [Figure 5], has been reported to diagnose several diseases such as ovarian cancer[61] and H1N1 influenza virus[50], which has also been very recently reported to be detected wash-free by the same device[51]. Drew A. Hall’s group from the University of California, San Diego has worked hard to improve the electronic circuitry of the GMR-CMOS interface in addition to noise removal circuit for such handheld device, thereby immensely contributing to the sensitivity of the handheld device[79,80].
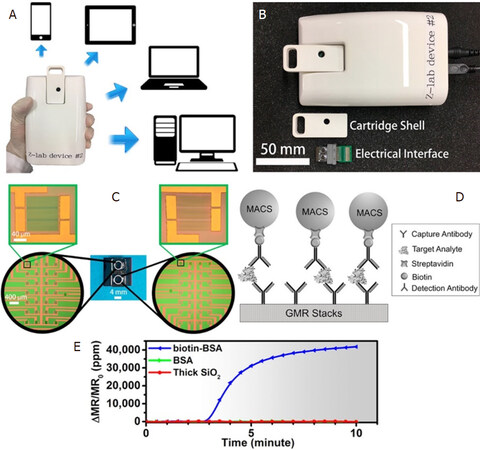
Figure 5. The Z-lab device can be connected to multiple types of devices such as cell phones, tablets, laptops, and desktop computers (A); the Z-Lab platform consists of three parts: a plastic cartridge, an electrical interface connecting the electrodes from GMR chip to the circuit board, and a handheld device (B); the layout of the GMR sensors (C); schematic illustration of the magnetic immunoassays on the sensor surface (D); real-time binding curve readout from Z-lab device (E)[50] (reprinted with permission from American Chemical Society). GMR: giant magnetoresistance
NMR
Origin of NMR signal
Elements that contain an odd number of protons and/or neutrons, such as 1H, 15N, 17O, 31P, etc., show intrinsic nonzero nuclear spins that give rise to small magnetic moments which can be observed by the NMR spectroscopy. Under a strong constant magnetic field B0, the magnetic moments are in equilibrium states, i.e., aligned either with or against the field denoted as M0 in Figure 6A[81,82]. A perturbation of the nuclear spins from equilibrium will occur when a weak oscillating magnetic field [referred to as radio frequency (rf) pulse] is applied whose frequency closely matches the nuclei’s intrinsic Larmor frequency. The Larmor frequency is proportional to the strength of the magnetic field and is also known as the resonant frequency as protons only absorb energy at this characteristic frequency. The time-domain signal responses by the total magnetization of nuclear spins are analyzed in NMR spectroscopy. As shown in Figure 6B, the net magnetization M0 is flipped by an angle of α, and it can be split into two components: Mx (longitudinal component) and Mxy (transverse component). Figure 6C shows a 90° rf pulse that delivers energy to rotate the Mo through 90°. This 90° rf pulse produces the largest possible transverse magnetization and NMR signal. The 180° rf pulses depicted in Figure 6D and E are used to prepare the net magnetization M0 before the application of an excitation pulse.
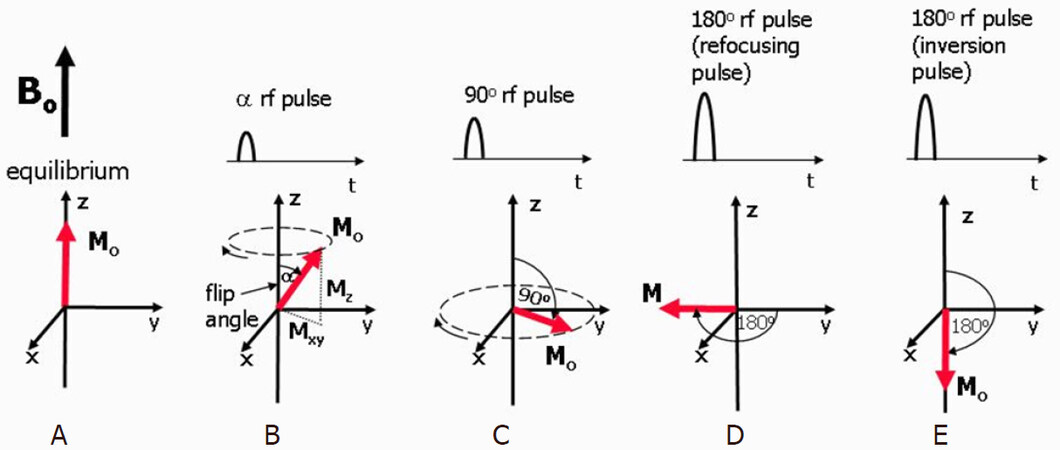
Figure 6. Equilibrium state. M0 is aligned along the z-axis (A); when a rf pulse is applied, M0 makes an angle with the z-axis and rotates around the axis in the direction of the curved arrow. The magnetization can be split into two components, Mz and Mxy. The rotating Mxy component generates the detectable NMR signal (B); the maximum detectable signal amplitude after a single rf pulse occurs when M0 lies entirely in the plane of the x- and y-axes as this gives the largest Mxy component. This pulse has a 90° flip angle and is referred to as a 90° rf pulse or saturation pulse (C); a 180° rf refocusing pulse is usually applied while there is transverse magnetization already rotating in the xy-plane and is used to instantaneously flip the transverse component of magnetization through 180° about an axis also rotating in the xy-plane (D); a 180° inversion pulse is usually applied at equilibrium and is used to rotate the net magnetization through 180° from the positive to the negative z-axis. This is also known as a magnetization preparation pulse (E)[81]
NMR metrices: T1, T2, and T2*
Immediately after the rf pulse, the net magnetization relaxes back to its original state, along the z-axis. This relaxation process can be split into two distinct relaxation processes that relate to Mz and Mxy. The longitudinal relaxation, also known as T1 relaxation, is the recovery of z-component Mx along the z-axis to its original value at equilibrium. The transverse relaxation, also known as T2 relaxation, is the decay of xy-component Mxy. Figure 7 shows the longitudinal relaxation process as well as the T1 time constants after a 90° rf pulse[82]. T1 is the time at which the Mx component has recovered to 63% of its value at equilibrium.
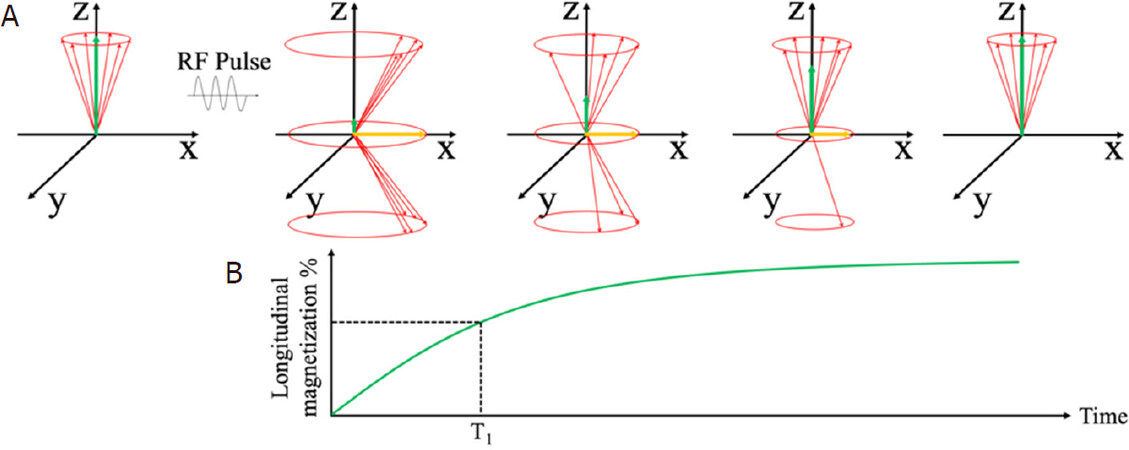
Figure 7. Schematic view of longitudinal magnetization components after the application of a 90° rf pulse. The longitudinal component Mz recovers to equilibrium value through an exponential process (A); Longitudinal relaxation time T1 at which the Mz recovers to 63% of its equilibrium value (B)[82] (reprinted with permission from IOP Publishing, Ltd)
For the transverse magnetization components, the phase angles spread out, there is a loss of coherence, and the magnetic moments are no longer together, as shown in Figure 8. The NMR signal detected from receiver coil is seen as an oscillating magnetic field that gradually decays. T2 is the time at which the magnetization has decayed to 37% of its initial value, which is caused by the interactions between neighboring proton spins. The local magnetic field non-uniformities cause the dephasing and result in varied Larmor frequencies for protons at different locations. This local field inhomogeneity results in the observed actual decay and T2* time constant. In the following sections, we review MNPs as contrast agents in NMR-based applications, where the MNPs generate local dipolar fields that cause local field inhomogeneity and, thus, tune the T2* time.
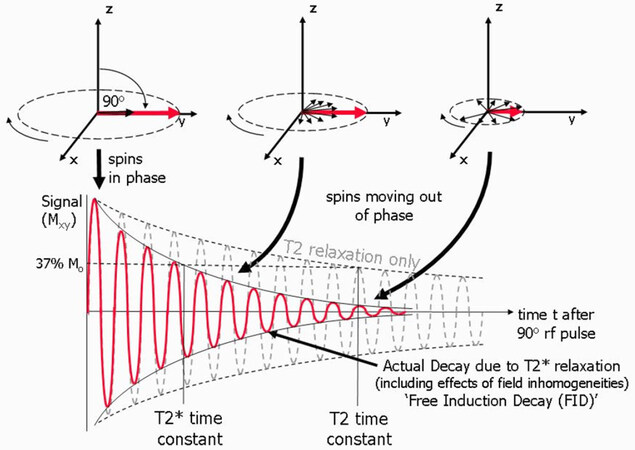
Figure 8. Schematic view of transverse magnetization components after the application of a 90° rf pulse. The transverse component Mxy decays to 37% of its initial value. The observed T2* relaxation time as a result of local field non-uniformities[81]
MNPs as contrast agents in NMR-based applications
In NMR-based applications, T1, T2, and T2* are used as metrics. Nowadays, NMR has been widely used for determining the structures of organic compounds and biomolecules as well as in magnetic resonance imaging (MRI)[83-87]. Since the biological samples show negligible magnetic susceptibility, MNPs are introduced as contrast agents for in vitro detection of biomolecules and cells based on NMR in recent years[88-91]. For most NMR-based applications, the primary NMR signals come from hydrogen nuclei contained within water or lipid molecules, due to: (1) intrinsic nonzero nuclear spins; and (2) natural abundance in the form of water and lipid molecules.
The foregoing sections describe MNP-based bioassays using technologies such as magnetoresistive and Hall sensors that directly measure the magnetic fields from MNP-labeled biological compounds. However, for MNP enhanced NMR bioassays, NMR spectroscopy exploits MNPs as proximity sensors that modulate the spin-spin relaxation time of water molecules adjacent to the MNPs, where the MNPs generate local dipolar fields that modulate the proton relaxation rates of billions of neighboring water molecules; thus, the analytical signals are directly generated from the whole sample volume. These MNPs are contrast agents in NMR to improve sensitivity in turbid samples with reduced sample preparation. In this section, we review the NMR-based diagnostics using MNPs for a wide range of applications including DNA, RNA, proteins, small molecules, tumor cells, etc.
NMR-based cancer diagnostics
MNPs along with NMR has been applied for many in vitro liquid biopsies including the detection of Listeria monocytogenes, Salmonella, and Cronobacter sakazakii from food[92,93] as well as the microcystin-LR (MC-LR) from water[94]. In this section, we review the applications in the area of cancer detection.
Lee’s group reported a DMR (diagnostic magnetic resonance) system based on NMR technology and MNP contrast agents. Conceptually, the DMR system consists of a microNMR (μNMR) chip containing microcoils, a microfluidic network for sample handling, on-board NMR electronics, and a small permanent magnet, as shown in Figure 9B-D. The microfluidic network in Figure 9C can effectively mix MNPs and biofluid sample (thus speeding up the specific binding to target analytes) by generating chaotic advection through the meandering channels. The NMR circuits in Figure 9E are designed to perform T2 and T1 measurements. The detection of MNP-labeled tumor cells is achieved by exploiting the T2-shortening effect of MNPs in NMR measurements, where the MNPs generate local dipolar fields with strong spatial dependence to destroy the coherence in the T2 relaxation of neighboring water protons. These MNP-labeled cells consequently show faster decay of NMR signal, or shorter T2 relaxation time than non-targeted cells, as shown in Figure 9A.
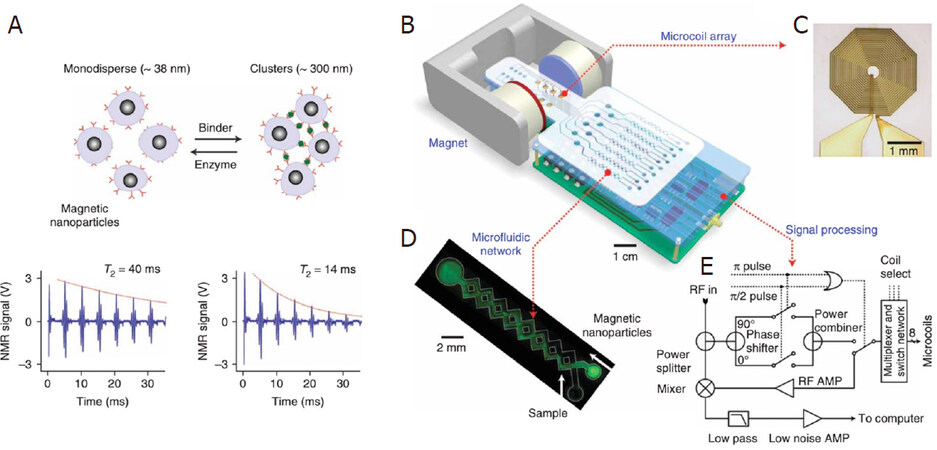
Figure 9. Principle of MNP-enhanced NMR bioassay. When monodispersed MNPs cluster upon binding to targets, the self-assembled clusters become more efficient at dephasing nuclear spins of many surrounding water protons, leading to a decrease in T2 relaxation time. The bottom panel shows an example of the proximity assay measured by the DMR system. Avidin was added to a solution of biotinylated magnetic nanoparticles, causing T2 to decrease from 40 to 14 ms (A); schematic diagram of the DMR system (B); the microcoil generates rf pulses (C); the microfluidic network (D); schematic of the NMR electronics (E)[89] (reprinted with permission from Springer Nature)
Using this DMR system, Ghazani et al.[95] reported the detection of circulating tumor cells (CTCs) directly from whole blood sample without primary purification. The detection is achieved by the combined and simultaneous sensing of four cancer biomarkers: EpCAM, HER-2, EGFR, and MUC-1. The monoclonal antibodies against EpCAM, HER-2, EGFR, and MUC-1 are conjugated with (E)-cyclooct-4-enyl 2,5-dioxopyrrolidin-1-yl carbonate (TCO-NHS), while the MNPs are tetrazine (Tz) modified. Each whole blood sample (7 mL) is lysed and cell pellets resuspended in PBS buffer. Then, TCO-modified antibodies are added and incubated for 15 min. Samples are washed twice and tetrazine-modified MNPs are added and incubated for 15 min. After another two cycles of washing steps, the mixture is suspended in 20 μL of PBS for μNMR measurements. The total labeling and incubation procedure takes approximately 30 min, as shown in Figure 10A. They reported the NMR measurements on 58 patients with confirmed epithelial malignancies. As shown in Figure 10B, these blood samples from 58 patients were profiled for four cancer biomarkers: EpCAM, MUC-1, HER-2, and EGFR. Although a notable fraction of the samples shows negative results for each biomarker, the combined biomarker analysis is able to correctly identify 99.2% of samples as malignant. As a comparison, Khosravi et al.[96,97] reported a nanotube-antibody micro-array chip for the detection of breast cancer cells from 0.85 mL spiked blood. A ~90% sensitivity and a 90% specificity in capture of 1000 SKBR3 breast cancer cells in blood using anti-Her2-functionalized devices are achieved. Later, in the same group, Loeian et al.[6] reported applying the nanotube chip for capturing CTCs from peripheral blood samples of breast cancer patients (stages 1-4). The CTCs (based on CK8/18, HER2, and EGFR) were successfully captured from 7/7 breast cancer patient samples and no CTCs were captured from healthy controls (n = 2). Salahandish et al.[98] reported an electrochemical biosensor for detecting as low as 2 cells/mL SK-BR3 breast cancer cells with a fast response time of 30 min. This electrochemical biosensor demonstrated an efficiency of > 90% for capturing cancer cells in whole blood sample without sample preparation and cell staining. Other platforms that detect CTCs from non-clinical samples have also been reported but are not covered in this review. For example, Tian et al.[99] reported an enzyme-free ELISA for HER2 detection from serum samples utilizing copper oxide nanoparticles as signal amplification probes.
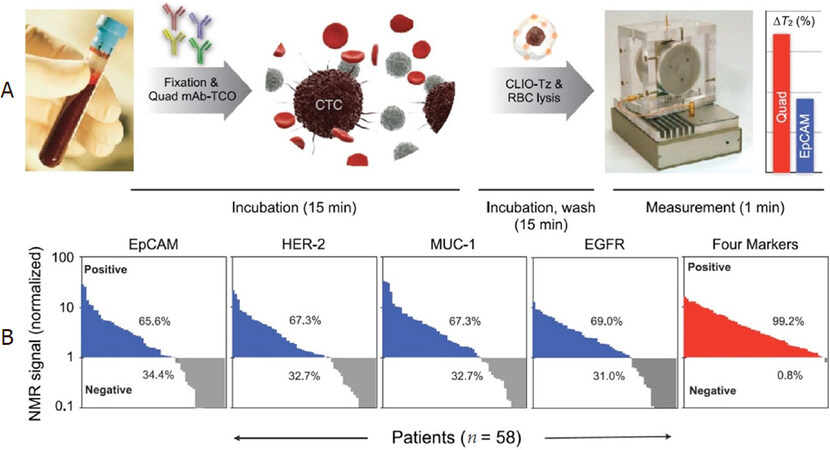
Figure 10. Schematic of the μNMR system. TCO-labeled antibodies are added to whole blood. Red blood cells are then lysed and the cells spun down before reaction with tetrazine-modified MNPs. The process of labeling antibodies and targeting nanoparticles requires less than 30 min. Biomarker measurements are then taken using the μNMR device (A); Biomarker expression, as assessed by μNMR, showed that significant percentages of cancer patients (n = 58) were negative for EpCAM (34.4%), HER-2 (32.7%), MUC-1 (32.7%), and EGFR (31.0%). Combining these markers, however, enabled identification of nearly all cancer patients (99.2%) (B)[95]. Reprinted with permission from Elsevier. μNMR: micro nuclear magnetic resonance; EpCAM: epithelial cell adhesion molecule; HER-2: human epidermal growth factor receptor 2; MUC-1: mucin 1; EGFR: epidermal growth factor receptor
Haun et al.[100] clinically tested on suspected lesions in 50 patients and validated in an independent cohort of another 20 patients using this DMR system. For each patient, a one- to two-pass fine-needle aspirate from a suspected abdominal malignancy was obtained, followed by a series of routine core biopsies for conventional standard-of-care analysis. Each fine-needle aspirate sample was washed with 1-2 mL of buffered saline and processed for μNMR measurements of 11 markers. These markers included nine well-established cancer-related markers (EpCAM (epithelial cell adhesion molecule), MUC-1 (mucin 1, cell surface associated), HER2, EGFR (epidermal growth factor receptor), B7-H3, CK18, Ki-67, p53, and vimentin), a count of CD45-positive cells, and total cell density. Their results show the μNMR-based measurements are comparable with the accepted gold standards such as enzyme-linked immunosorbent assay (ELISA), fluorescence-activated cell sorting (FACS), and immunohistochemistry (IHC). The correlation coefficients between μNMR and ELISA, FACS, and IHC measurements for expression of EGFR are 0.99, 0.98, and 0.93, respectively. It was shown that EGFR and HER2 had a good correlation (coefficient = 0.6), whereas EpCAM and HER2 had a poor correlation (coefficient = 0.1). The comparison of different detection technologies for liquid biopsy is shown in Table 1.
Comparison of different platforms for liquid biopsies
| Technology | Target analytes | Substrate | Sensitivity | Assay time | Ref. |
|---|---|---|---|---|---|
| GMR | CA125 II, HE4, IL6 | PBS | 3.7 U/mL, 7.4 pg/mL, 7.4 pg/mL | 15 min | [61] |
| GMR | Endoglin | Urine | 83 fM | 10 min | [63] |
| GMR | hcG | Serum | 1 pM | 3 min | [64] |
| GMR | exosome | PBS | 100 counts | 30 min | [65] |
| GMR | Methylated DNA | Denaturation buffer | 0.1% | 30 min | [68] |
| GMR | cfDNA(AU115, AU247) | NA | pM range | 80 min | [70] |
| TMR | AFP | PBS | 2 μg/mL | NA | [66] |
| TMR | Commercial ssDNA | PBS | 5 nmol/L | NA | [67] |
| NMR | Circulating tumor cells (CTCs) | Whole blood | ~3 individual CTCs per sample (1-10 mL blood) | 30 min | [95] |
| NMR | Nine cancer-related markers: EpCAM, MUC-1 (cell surface associated), HER2, EGFR, B7-H3, CK18, Ki-67, p53, and vimentin | Whole blood | See Table 2[95] | 60 min | [100] |
Conclusion
Liquid biopsy is an emerging research field with great promise in serving as a noninvasive technology for cancer diagnosis and cancer therapy. Magnetic nanotechnologies play an import role in both biomarker separation and biomarker detection. MNPs can bound to the target biomarkers through immunoassays and facilitate the separation of the biomarkers through the magnetophoresis effect. MNPs with high magnetic moment have been synthesized together with biocompatible surface coatings that can accommodate the bounding between MNPs and target biomarkers. Besides synthesizing novel MNPs, the research on magnetic separation also focuses on the optimization of the magnetic field configuration as well as the integration with other biomarker concentration technologies to achieve high biomarker capture efficiency, high specificity, and ease of integration with biosensing platforms. To realize precise fluidic control, minimum biological sample consumption, and better performance in biomarker separation and biosensing, microfluidic channels have become a key part in the designing of liquid biopsy platforms. Apart from the traditional mold casting techniques, novel approaches such as 3D printing and laser writing have been proposed to fabricate microfluidic channels with more complexed structures and higher resolutions.
Biosensors based on magnetic nanotechnologies exhibit low background noise and are less influenced by the biological and chemical environment during detection, since most of the biological samples are paramagnetic. Magnetoresistance sensors including GMR and TMR sensors detect the signal from the MNPs that are brought into proximity of the sensor surface via immunoassays or DNA-based assays. Various biomarkers have been demonstrated for liquid biopsy applications. Point-of-care devices based on MR sensors have been developed by several groups, which could pave the way for bedside liquid biopsies with high sensitivity, high portability, and short detection time. In addition to MR sensors, NMR bioassay platforms along with MNP contrast agents exploit the magnetic resonance technology for the detection of cancer cells. Samples containing MNP-labeled cells show faster relaxation in NMR signals due to the local magnetic field inhomogeneity caused by MNPs. This type of NMR signal detection is based on magnetic interactions (interactions between neighboring proton spins) and, thus, requires minimal sample purification steps, which, as a result, reduces cells loss and simplifies the assay procedures. In the past few years, the NMR platform has been considerably advanced and developed into a sensitive and robust detection tool for a wide range of biomarker/cell detections. Magnetic nanotechnology, with its application in both biomarker separation and detection, has demonstrated great potential for the development of liquid biopsy platforms to achieve sensitive, efficient, and portable cancer diagnosis and cancer therapy.
Declarations
Authors’ contributionsAbstract, sections 1, 2.2, 3.1, 4.1, 4.2, 6 was contributed by Su D.
Section 5 was contributed by Wu K.
Sections 3.2 and 4.3 was contributed by Saha R.
Section 2.1 was contributed by Liu J.
Supervised the completion of this review: Wang JP
Availability of data and materialsNot applicable.
Financial support and sponsorshipThis study was financially supported by the Institute of Engineering in Medicine of the University of Minnesota through FY18 IEM Seed Grant Funding Program and the Doctoral Dissertation Fellowship.
Conflicts of interestAll authors declared that there are no conflicts of interest.
Ethical approval and consent to participateNot applicable.
Consent for publicationNot applicable.
Copyright© The Author(s) 2020.
REFERENCES
1. Definition of liquid biopsy n.d. Available from: https://www.cancer.gov/publications/dictionaries/cancer-terms/def/liquid-biopsy. [Last accessed on 30 Jun 2020].
2. Castro-Giner F, Gkountela S, Donato C, Alborelli I, Quagliata L, et al. Cancer diagnosis using a liquid biopsy: challenges and expectations. Diagnostics (Basel) 2018;8:31.
3. Ghosh RK, Pandey T, Dey P. Liquid biopsy: a new avenue in pathology. Cytopathology 2019;30:138-43.
4. Snow A, Chen D, Lang JE. The current status of the clinical utility of liquid biopsies in cancer. Expert Rev Mol Diagn 2019;19:1031-41.
5. Siravegna G, Marsoni S, Siena S, Bardelli A. Integrating liquid biopsies into the management of cancer. Nat Rev Clin Oncol 2017;14:531-48.
6. Loeian MS, Mehdi Aghaei S, Farhadi F, Rai V, Yang HW, et al. Liquid biopsy using the nanotube-CTC-chip: capture of invasive CTCs with high purity using preferential adherence in breast cancer patients. Lab Chip 2019;19:1899-915.
7. Yu Y, Yang Y, Ding J, Meng S, Li C, et al. Design of a biocompatible and ratiometric fluorescent probe for the capture, detection, release, and reculture of rare number CTCs. Anal Chem 2018;90:13290-8.
8. Kim DM, Kim DH, Jung W, Lee KY, Kim DE. Fluorometric detection of EGFR exon 19 deletion mutation in lung cancer cells using graphene oxide. Analyst 2018;143:1797-804.
9. Tang Z, Huang J, He H, Ma C, Wang K. Contributing to liquid biopsy: Optical and electrochemical methods in cancer biomarker analysis. Coordination Chemistry Reviews 2020;415:213317.
10. Shields Iv CW, Wang JL, Ohiri KA, Essoyan ED, Yellen BB, et al. Magnetic separation of acoustically focused cancer cells from blood for magnetographic templating and analysis. Lab Chip 2016;16:3833-44.
11. Tang M, Wen CY, Wu LL, Hong SL, Hu J, et al. A chip assisted immunomagnetic separation system for the efficient capture and in situ identification of circulating tumor cells. Lab Chip 2016;16:1214-23.
12. Zhang Q, Wang W, Huang S, Yu S, Tan T, et al. Capture and selective release of multiple types of circulating tumor cells using smart DNAzyme probes. Chem Sci 2020;11:1948-56.
13. Gao Y, Yuan Z. Nanotechnology for the detection and kill of circulating tumor cells. Nanoscale Res Lett 2014;9:500.
14. Aghaamoo M, Zhang Z, Chen X, Xu J. Deformability-based circulating tumor cell separation with conical-shaped microfilters: concept, optimization, and design criteria. Biomicrofluidics 2015;9:034106.
15. Gwak H, Kim J, Kashefi-Kheyrabadi L, Kwak B, Hyun KA, et al. Progress in circulating tumor cell research using microfluidic devices. Micromachines (Basel) 2018;9:353.
16. Yu X, Wang B, Zhang N, Yin C, Chen H, et al. Capture and release of cancer cells by combining on-chip purification and off-chip enzymatic treatment. ACS Appl Mater Interfaces 2015;7:24001-7.
17. Gurudatt NG, Chung S, Kim JM, Kim MH, Jung DK, et al. Separation detection of different circulating tumor cells in the blood using an electrochemical microfluidic channel modified with a lipid-bonded conducting polymer. Biosens Bioelectron 2019;146:111746.
18. Bruus H. Theoretical microfluidics. Oxford: University Press Oxford; 2008.
20. Liang C, Li Y, Luo J. A novel method to detect functional microRNA regulatory modules by bicliques merging. IEEE/ACM Trans Comput Biol Bioinform 2016;13:549-56.
21. Miller A, Carchman R, Long R, Denslow SA. La Crosse viral infection in hospitalized pediatric patients in Western North Carolina. Hosp Pediatr 2012;2:235-42.
22. Bai J, Xu Y, Thomas J, Wang J. (FeCo) 3 Si-SiO x core-shell nanoparticles fabricated in the gas phase. Nanotechnology 2007;18:065701.
23. Wei X, Zhu G, Liu Y, Ni Y, Song Y, et al. Large-scale controlled synthesis of FeCo nanocubes and microcages by wet chemistry. Chem Mater 2008;20:6248-53.
24. Chakka VM, Altuncevahir B, Jin ZQ, Li Y, Liu JP. Magnetic nanoparticles produced by surfactant-assisted ball milling. J Appl Phys 2006;99:08E912.
25. Chen P, Huang YY, Bhave G, Hoshino K, Zhang X. Inkjet-print micromagnet array on glass slides for immunomagnetic enrichment of circulating tumor cells. Ann Biomed Eng 2016;44:1710-20.
26. Schreier S, Sawaisorn P, Udomsangpetch R, Triampo W. Advances in rare cell isolation: an optimization and evaluation study. J Transl Med 2017;15:6.
27. Rao L, Meng QF, Huang Q, Wang Z, Yu GT, et al. Platelet-leukocyte hybrid membrane-coated immunomagnetic beads for highly efficient and highly specific isolation of circulating tumor cells. Adv Funct Mater 2018;28:1803531.
28. Earhart CM, Hughes CE, Gaster RS, Ooi CC, Wilson RJ, et al. Isolation and mutational analysis of circulating tumor cells from lung cancer patients with magnetic sifters and biochips. Lab Chip 2014;14:78-88.
29. McDonald JC, Whitesides GM. Poly(dimethylsiloxane) as a material for fabricating microfluidic devices. Acc Chem Res 2002;35:491-9.
30. Mcdonald JC, Duffy DC, Anderson JR, Chiu DT, Wu H, et al. Fabrication of microfluidic systems in poly(dimethylsiloxane). Electrophoresis 2000;21:27-40.
31. Chaudhury MK, Whitesides GM. Direct measurement of interfacial interactions between semispherical lenses and flat sheets of poly(dimethylsiloxane) and their chemical derivatives. Langmuir 1991;7:1013-25.
32. Hwang Y, Candler RN. Non-planar PDMS microfluidic channels and actuators: a review. Lab Chip 2017;17:3948-59.
33. Chen C, Mehl BT, Munshi AS, Townsend AD, Spence DM, et al. 3D-printed microfluidic devices: fabrication, advantages and limitations-a mini review. Anal Methods 2016;8:6005-12.
34. Gross BC, Anderson KB, Meisel JE, McNitt MI, Spence DM. Polymer coatings in 3D-printed fluidic device channels for improved cellular adherence prior to electrical lysis. Anal Chem 2015;87:6335-41.
35. Song S, Lee C, Kim T, Shin I, Jun S, et al. A rapid and simple fabrication method for 3-dimensional circular microfluidic channel using metal wire removal process. Microfluid Nanofluid 2010;9:533-40.
36. He F, Cheng Y, Xu Z, Liao Y, Xu J, et al. Direct fabrication of homogeneous microfluidic channels embedded in fused silica using a femtosecond laser. Opt Lett 2010;35:282-4.
37. Inglis DW, Riehn R, Austin RH, Sturm JC. Continuous microfluidic immunomagnetic cell separation. Appl Phys Lett 2004;85:5093-5.
38. Han K-H, Frazier AB. A microfluidic system for continuous magnetophoretic separation of suspended cells using their native magnetic properties. Proc Nanotech 2005;1:187-90.
39. Afshar R, Moser Y, Lehnert T, Gijs M. Magnetic particle dosing and size separation in a microfluidic channel. Sensors and Actuators B:. Chemical 2011;154:73-80.
40. Brouzes E, Kruse T, Kimmerling R, Strey HH. Rapid and continuous magnetic separation in droplet microfluidic devices. Lab Chip 2015;15:908-19.
41. Weddemann A, Wittbracht F, Auge A, Huetten A. A hydrodynamic switch: Microfluidic separation system for magnetic beads. Appl Phys Lett 2009;94:173501.
42. Jung SH, Hahn YK, Oh S, Kwon S, Um E, et al. Advection flows-enhanced magnetic separation for high-throughput bacteria separation from undiluted whole blood. Small 2018;14:e1801731.
43. Hou Y, Cai G, Zheng L, Lin J. A microfluidic signal-off biosensor for rapid and sensitive detection of Salmonella using magnetic separation and enzymatic catalysis. Food Control 2019;103:186-93.
44. Khashan S, Alazzam A, Mathew B, Hamdan M. Mixture model for biomagnetic separation in microfluidic systems. J Magn Magn Mater 2017;442:118-27.
45. Wu J, Yan Q, Xuan S, Gong X. Size-selective separation of magnetic nanospheres in a microfluidic channel. Microfluid Nanofluid 2017;21.
46. Oh S, Jung SH, Seo H, Min M, Kim B, et al. Magnetic activated cell sorting (MACS) pipette tip for immunomagnetic bacteria separation. Sensors and Actuators B:. Chemical 2018;272:324-30.
47. Gao R, Cheng Z, deMello AJ, Choo J. Wash-free magnetic immunoassay of the PSA cancer marker using SERS and droplet microfluidics. Lab Chip 2016;16:1022-9.
48. Su D, Wu K, Saha R, Peng C, Wang JP. Advances in Magnetoresistive Biosensors. Micromachines (Basel) 2019;11:34.
49. Srinivasan B, Li Y, Jing Y, Xu Y, Yao X, et al. A detection system based on giant magnetoresistive sensors and high-moment magnetic nanoparticles demonstrates zeptomole sensitivity: potential for personalized medicine. Angew Chem Int Ed 2009;48:2764-7.
50. Wu K, Klein T, Krishna VD, Su D, Perez AM, et al. Portable GMR handheld platform for the detection of influenza A virus. ACS Sens 2017;2:1594-601.
51. Su D, Wu K, Krishna VD, Klein T, Liu J, et al. Detection of influenza a virus in swine nasal swab samples with a wash-free magnetic bioassay and a handheld giant magnetoresistance sensing system. Front Microbiol 2019;10:1077.
52. Thomson W. XIX. On the electro-dynamic qualities of metals:-Effects of magnetization on the electric conductivity of nickel and of iron. Proc R Soc Lond 1857;8:546-50.
53. Mott NF. The resistance and thermoelectric properties of the transition metals. Proc R Soc Lond A 1936;156:368-82.
54. Fert A, Campbell IA. Electrical resistivity of ferromagnetic nickel and iron based alloys. J Phys F Met Phys 1976;6:849.
55. Snoek J. The Weiss-Heisenberg theory of ferro-magnetism and a new rule concerning magnetostriction and magnetoresistance. Nature 1949;163:837.
56. Baibich MN, Broto JM, Fert A, Van Dau FN, Petroff F, et al. Giant magnetoresistance of (001) Fe/(001) Cr magnetic superlattices. Phys Rev Lett 1988;61:2472.
58. Parkin SS, More N, Roche KP. Oscillations in exchange coupling and magnetoresistance in metallic superlattice structures: Co/Ru, Co/Cr, and Fe/Cr. Phys Rev Lett 1990;64:2304-7.
59. Parkin SS, Kaiser C, Panchula A, Rice PM, Hughes B, et al. Giant tunnelling magnetoresistance at room temperature with MgO (100) tunnel barriers. Nat Mater 2004;3:862-7.
60. Chikkaveeraiah BV, Bhirde AA, Morgan NY, Eden HS, Chen X. Electrochemical immunosensors for detection of cancer protein biomarkers. ACS Nano 2012;6:6546-61.
61. Klein T, Wang W, Yu L, Wu K, Boylan KLM, et al. Development of a multiplexed giant magnetoresistive biosensor array prototype to quantify ovarian cancer biomarkers. Biosens Bioelectron 2019;126:301-7.
62. Gao Y, Huo W, Zhang L, Lian J, Tao W, et al. Multiplex measurement of twelve tumor markers using a GMR multi-biomarker immunoassay biosensor. Biosens Bioelectron 2019;123:204-10.
63. Srinivasan B, Li Y, Jing Y, Xing C, Slaton J, et al. A three-layer competition-based giant magnetoresistive assay for direct quantification of endoglin from human urine. Anal Chem 2011;83:2996-3002.
64. Osterfeld SJ, Yu H, Gaster RS, Caramuta S, Xu L, et al. Multiplex protein assays based on real-time magnetic nanotag sensing. Proc Natl Acad Sci 2008;105:20637-40.
65. Zhu F, Li D, Ding Q, Lei C, Ren L, et al. 2D magnetic MoS2-Fe3O4 hybrid nanostructures for ultrasensitive exosome detection in GMR sensor. Biosens Bioelectron 2020;147:111787.
66. Lei ZQ, Li L, Li GJ, Leung CW, Shi J, et al. Liver cancer immunoassay with magnetic nanoparticles and MgO-based magnetic tunnel junction sensors. J Appl Phys 2012;111:07E505.
67. Grancharov SG, Zeng H, Sun S, Wang SX, O’Brien S, et al. Bio-functionalization of monodisperse magnetic nanoparticles and their use as biomolecular labels in a magnetic tunnel junction based sensor. J Phys Chem B 2005;109:13030-5.
68. Nesvet J, Rizzi G, Wang SX. Highly sensitive detection of DNA hypermethylation in melanoma cancer cells. Biosens Bioelectron 2019;124:136-42.
69. Rizzi G, Lee JR, Dahl C, Guldberg P, Dufva M, et al. Simultaneous profiling of DNA mutation and methylation by melting analysis using magnetoresistive biosensor array. ACS Nano 2017;11:8864-70.
70. Dias TM, Cardoso FA, Martins SAM, Martins VC, Cardoso S, et al. Implementing a strategy for on-chip detection of cell-free DNA fragments using GMR sensors: a translational application in cancer diagnostics using ALU elements. Anal Methods 2016;8:119-28.
71. Kricka LJ, Park JY. Magnetism and magnetoresistance: attractive prospects for point-of-care testing? Clin Chem 2009;55:1058-60.
72. Luppa PB, Müller C, Schlichtiger A, Schlebusch H. Point-of-care testing (POCT): current techniques and future perspectives. TrAC Trends Anal Chem 2011;30:887-98.
73. Gani AW, Wei W, Shi RZ, Ng E, Nguyen M, et al. An automated, quantitative, and multiplexed assay suitable for point-of-care hepatitis B virus diagnostics. Sci Rep 2019;9:1-11.
74. Xu L, Lee JR, Hao S, Ling XB, Brooks JD, et al. Improved detection of prostate cancer using a magneto-nanosensor assay for serum circulating autoantibodies. PLoS One 2019;14.
75. Lee JR, Appelmann I, Miething C, Shultz TO, Ruderman D, et al. Longitudinal multiplexed measurement of quantitative proteomic signatures in mouse lymphoma models using magneto-nanosensors. Theranostics 2018;8:1389.
76. Ng E, Yao C, Shultz TO, Ross-Howe S, Wang SX. Magneto-nanosensor smartphone platform for the detection of HIV and leukocytosis at point-of-care. Nanomed Nanotechnol Biol Med 2019;16:10-9.
77. Ravi N, Rizzi G, Chang SE, Cheung P, Utz PJ, et al. Quantification of cDNA on GMR biosensor array towards point-of-care gene expression analysis. Biosens Bioelectron 2019;130:338-43.
78. Nair VS, Beggs M, Yu H, Carbonell L, Wang SX, et al. Validation of plasma TIMP-1 to identify lung cancer in smokers. D99. Clinically informative biomarkers in lung cancer: a needle in a haystack. San Diego: American Thoracic Society; 2018. p. A7415.
79. Zhou X, Sveiven M, Hall DA. A CMOS magnetoresistive sensor front-end with mismatch-tolerance and sub-ppm sensitivity for magnetic immunoassays. IEEE Trans Biomed Circuits Syst 2019;13:1254-63.
80. Zhou X, Sveiven M, Hall DA. 11.4 A fast-readout mismatch-insensitive magnetoresistive biosensor front-end achieving Sub-ppm sensitivity. 2019 IEEE International Solid-State Circuits Conference-(ISSCC). San Francisco: IEEE; 2019. pp. 196-8.
81. Ridgway JP. Cardiovascular magnetic resonance physics for clinicians: part I. J Cardiovasc Magn Reson 2010;12:71.
82. Wu K, Su D, Liu J, Saha R, Wang JP. Magnetic nanoparticles in nanomedicine: a review of recent advances. Nanotechnology 2019;30:502003.
83. Lovchinsky I, Sushkov AO, Urbach E, de Leon NP, Choi S, et al. Nuclear magnetic resonance detection and spectroscopy of single proteins using quantum logic. Science 2016;351:836-41.
84. Kabsch W, Rösch P. Nuclear magnetic resonance: Protein structure determination. Nature 1986;321:469-70.
85. Wilson MA. Applications of nuclear magnetic resonance spectroscopy to the study of the structure of soil organic matter. J Soil Sci 1981;32:167-86.
86. Debette S, Schilling S, Duperron MG, Larsson SC, Markus HS. Clinical significance of magnetic resonance imaging markers of vascular brain injury: a systematic review and meta-analysis. JAMA Neurol 2019;76:81-94.
87. Willke P, Yang K, Bae Y, Heinrich AJ, Lutz CP. Magnetic resonance imaging of single atoms on a surface. Nat Phys 2019;15:1005-10.
88. Shao H, Yoon TJ, Liong M, Weissleder R, Lee H. Magnetic nanoparticles for biomedical NMR-based diagnostics. Beilstein J Nanotechnol 2010;1:142-54.
89. Lee H, Sun E, Ham D, Weissleder R. Chip-NMR biosensor for detection and molecular analysis of cells. Nat Med 2008;14:869.
90. Lee H, Yoon TJ, Weissleder R. Ultrasensitive detection of bacteria using core-shell nanoparticles and an NMR-filter system. Angew Chem 2009;121:5767-70.
91. Zou D, Jin L, Wu B, Hu L, Chen X, et al. Rapid detection of Salmonella in milk by biofunctionalised magnetic nanoparticle cluster sensor based on nuclear magnetic resonance. Int Dairy J 2019;91:82-8.
92. Zhao Y, Li Y, Jiang K, Wang J, White WL, et al. Rapid detection of Listeria monocytogenes in food by biofunctionalized magnetic nanoparticle based on nuclear magnetic resonance. Food Control 2017;71:110-6.
93. Zhao Y, Yao Y, Xiao M, Chen Y, Lee CC, et al. Rapid detection of Cronobacter sakazakii in dairy food by biofunctionalized magnetic nanoparticle based on nuclear magnetic resonance. Food Control 2013;34:436-43.
94. Ma W, Chen W, Qiao R, Liu C, Yang C, et al. Rapid and sensitive detection of microcystin by immunosensor based on nuclear magnetic resonance. Biosens Bioelectron 2009;25:240-3.
95. Ghazani AA, Castro CM, Gorbatov R, Lee H, Weissleder R. Sensitive and direct detection of circulating tumor cells by multimarker µ-nuclear magnetic resonance. Neoplasia (New York, NY) 2012;14:388.
96. Khosravi F, Trainor PJ, Lambert C, Kloecker G, Wickstrom E, et al. Static micro-array isolation, dynamic time series classification, capture and enumeration of spiked breast cancer cells in blood: the nanotube-CTC chip. Nanotechnology 2016;27:44LT03.
97. Khosravi F, Loeian SM, Panchapakesan B. Ultrasensitive label-free sensing of IL-6 Based on PASE functionalized carbon nanotube micro-arrays with RNA-aptamers as molecular recognition elements. Biosensors (Basel) 2017;7:17.
98. Salahandish R, Ghaffarinejad A, Naghib SM, Majidzadeh-A K, Zargartalebi H, et al. Nano-biosensor for highly sensitive detection of HER2 positive breast cancer. Biosens Bioelectron 2018;117:104-11.
99. Tian S, Zeng K, Yang A, Wang Q, Yang M. A copper based enzyme-free fluorescence ELISA for HER2 detection. J Immunol Methods 2017;451:78-82.
Cite This Article
Export citation file: BibTeX | RIS
OAE Style
Su D, Wu K, Saha R, Liu J, Wang JP. Magnetic nanotechnologies for early cancer diagnostics with liquid biopsies: a review. J Cancer Metastasis Treat 2020;6:19. http://dx.doi.org/10.20517/2394-4722.2020.48
AMA Style
Su D, Wu K, Saha R, Liu J, Wang JP. Magnetic nanotechnologies for early cancer diagnostics with liquid biopsies: a review. Journal of Cancer Metastasis and Treatment. 2020; 6: 19. http://dx.doi.org/10.20517/2394-4722.2020.48
Chicago/Turabian Style
Su, Diqing, Kai Wu, Renata Saha, Jinming Liu, Jian-Ping Wang. 2020. "Magnetic nanotechnologies for early cancer diagnostics with liquid biopsies: a review" Journal of Cancer Metastasis and Treatment. 6: 19. http://dx.doi.org/10.20517/2394-4722.2020.48
ACS Style
Su, D.; Wu K.; Saha R.; Liu J.; Wang J.P. Magnetic nanotechnologies for early cancer diagnostics with liquid biopsies: a review. J. Cancer. Metastasis. Treat. 2020, 6, 19. http://dx.doi.org/10.20517/2394-4722.2020.48
About This Article
Special Issue
Copyright

Data & Comments
Data


 Cite This Article 17 clicks

 Like This Article 30
likes
Like This Article 30
likes


Comments
Comments must be written in English. Spam, offensive content, impersonation, and private information will not be permitted. If any comment is reported and identified as inappropriate content by OAE staff, the comment will be removed without notice. If you have any queries or need any help, please contact us at support@oaepublish.com.