
Metabolomics in cancer and cancer-associated inflammatory cells

Abstract
Metabolomics is the last frontier of modern molecular biology, and the state-of-the-art technique for studying metabolism. Mass spectrometry and nuclear magnetic resonance spectroscopy are the main analytical approaches in metabolomics. Cellular metabolism plays a pivotal role during cell resting and activation. Immune cells exhibit remarkable metabolic plasticity, fundamental to support their adaptation to inflammatory environments and functional requirements. Cancer is a metabolic and inflammatory disease. A metabolic shift is crucial for oncogenesis, tumor cell survival, invasion, metastasis, and the associated inflammatory process. The tumor microenvironment is mainly orchestrated by immune-inflammatory cells and essential for the neoplastic process. Inflammatory cells from tumor stroma adapt to different metabolic pathways during tumor progression, and this metabolic reprogramming affects macrophages, neutrophils, T cells, and others. Targeting the metabolism of tumor and immune cells may lead to important therapeutic implications in cancer. Thus, understanding the metabolic changes that drive the interactions between tumor and stromal cells is a promising avenue advances in cancer diagnostics and therapies, leading to more accurate guidance. In this review, we discuss the most recent metabolomics approaches in cancer studies on the tumor-associated inflammatory microenvironment.
Keywords
Introduction
Metabolomics stands for the large-scale analysis of a complex mixture of metabolites. It has changed the linear concept of the biology’s central dogma, once the metabolites, molecules less than 1.5 kDa, are the substrate for other omics, such as genomics, transcriptomics, and proteomics. The concept of a “metabolic pattern” was already introduced in the late 1940s[1], and the term metabolic profile was used for the first time in 1978 in a research article[2]. Twenty years later, the term “metabolomics” was coined in analogy with other omics by Steven Oliver in a review article[3]. Among omics, metabolomics is the closest to the phenotype. Mass spectrometry (MS) and nuclear magnetic resonance (NMR) spectroscopy are the most used techniques in metabolomics. Although MS is more sensitive than NMR, the latter is more reproducible and nondestructive, and it allows in vivo analysis[4-6]. Both techniques are able to characterize cancer cells and distinguish the rich and diverse phenotypes of stromal cells present in the tumor microenvironment.
Cancer is a complex disease, and, even after years of study, its treatment is still a challenge. Although therapeutic escape during cancer treatment can be caused by epigenetic changes that lead to certain plasticity[7], better identification of the tumors through comprehensive omics may modify paradigms in translational cancer research. In this context, metabolomics can address still open questions, such as the differentiation between primary tumors and metastasis when radiology and histopathological approaches are unfeasible or provide unclear results[7,8]. Furthermore, metabolomics allows the identification of carcinoma biomarkers in plasma[9,10] and tissue samples[11,12]. However, despite the relevance of metabolic approaches, similar findings may be misinterpreted as they are often associated with whole-body metabolism. Evidence shows that active metabolic pathways in tumor cells can directly affect other cells within the tumor microenvironment, such as fibroblasts, endothelial cells, and immune cells[13]. Therefore, identifying the metabolic profile of each cell type within the tumor microenvironment might allow the identification and characterization of functional biomarkers that are representative of cellular processes or the individuality of each cell[7,14,15].
Beyond the Warburg effect
Otto Warburg first proposed the importance of cell metabolism in cancer in the 1920s, indicating that tumors have enhanced lactate levels compared with those in normal tissues[16-19]. The Warburg effect is based on the idea that, compared with normal cells, tumor cells prefer anaerobic glycolysis, even in the presence of sufficient oxygen, which indicates mitochondria malfunction in tumor cells. However, in recent years, with the advances in metabolomics, the Warburg effect has been revisited and, together with other cell metabolic alterations, is discussed in this review, not only in tumor cells but also in immune cells present in the tumor microenvironment.
Several studies support that the Warburg effect is not a “dogma” in cancer cells. For example, glioblastoma cells exhibit the Warburg effect but also use glutamine metabolism[20], and they require pyruvate carboxylase for glutamine-independent growth[21]. Some cancer cells, mostly metastatic invasive cells[22,23], show increased oxidative phosphorylation (OXPHOS) in mitochondria[24,25], and, when they undergo a metabolic shift characteristic of the Warburg effect, a drug-resistant phenotype is observed[26,27]. Fatty acid oxidation is also an important metabolic pathway in cancer. Some subsets of lymphoma rely on fatty acid oxidation for survival[28]. Prostate cancer cells show increased consumption of saturated fatty acids[29] and polyunsaturated omega-6 fatty acids[30] and low citrate, spermine, and myo-inositol levels[31-34]. In addition, higher levels of cholesterol were associated with prostate cancer metastasis to the bones[35]. Two key metabolic pathways other than glycolysis have been related to cancer: the polyol pathway and pentose phosphate pathway (PPP). The increased expression of the aldo-keto reductase family 1 member B1 (AKR1B1) gene, which is responsible for the conversion of glucose into sorbitol (i.e., the first step in the polyol pathway), has been linked with epithelial-to-mesenchymal transition in lung and colon cancer[36]. High levels of the sugar alcohol sorbitol have been observed in ovarian adenocarcinoma[37] and clear cell papillary renal cell carcinoma, a subtype of renal tumor[38]. Additionally, enhanced PPP is important to provide nucleotides and nicotinamide adenine dinucleotide phosphate (NADPH) for the rapid growth of tumor cells and the detoxification of intracellular reactive oxygen species (ROS). Glycosylation of the PPP rate-limiting enzyme glucose-6-phosphate dehydrogenase (G6PD) activates this enzyme in tumors and thereby enhances the conversion of glucose-6-phosphate to 6-phosphoglucolactone.
Metabolic shifts linked to cancer transformation and metastasis have been studied by metabolomics. The metabolomics of clear cell renal cell carcinoma showed increased levels of PPP metabolites, such as glucose-6-phosphate, ribose-5-phosphate, ribulose-5-phosphate/xylulose 5-phosphate, and sedoheptulose-7-phosphate[39]. In a study employing a melanoma progression model, NMR analysis showed enhanced levels of pyruvate, isocitrate, succinate, glutamine, oxaloacetate, and L-aspartate in highly metastatic cells. In addition, these cells showed a completely different metabolic profile from that of non-metastatic and normal cells[22]. In another key metabolomics study, the profile of 157 metabolites was assessed in a syngeneic mouse mammary tumor model by LC-MS/MS, revealing a two-step metabolic model during breast cancer progression. Although the glycolysis pathway was altered in both steps, the first transformation step (i.e., the transformation from normal to primary tumor cells) was linked to changes in metabolites related to PPP and fatty acid synthesis, whereas the second step (i.e., acquisition of metastatic ability) was associated with the tricarboxylic acid (TCA) cycle and nucleotide metabolism[40].
Several metabolic processes are altered in cancer, not only in tumor cells but also in stromal cells, in the metastatic niche, and other cells and tissues throughout the body, resulting in high metabolic heterogeneity[23]. Metabolites that induce such metabolic changes could represent potential biomarkers for identifying different cancers or cancer activities[41].
Metabolic profile of cancer cells
Despite the presence of oxygen, tumor cells undergo glycolysis to produce lactate through the stabilization of Hypoxia Inductible Factor 1 alfa (HIF-1α) and the expression of glucose transporters and glycolytic enzymes[42,43], thereby generating ATP through fermentation, which is faster than Oxidative Phosphorylation (OXPHOS)[44,45]. In this scenario, the TCA cycle is committed to biosynthesis rather than ATP production. Glutaminolysis is a metabolic pathway that replenishes the TCA cycle with intermediates produced from glutamine, thereby it generates reducing equivalents. Despite being a conditional amino acid, glutamate, a product of glutaminolysis, becomes essential during rapid cell growth[46]. Furthermore, glutamate acts as a nitrogen carrier to support alanine and aspartate synthesis. These metabolic pathways can interact with the tumor microenvironment once alanine is released by tumor cells. Glutamine is involved in glutathione (GSH) biosynthesis, which in its reduced form confers resistance to oxidative stress and inflammation[47]. β-catenin induces glutamine synthesis rather than glycolysis and glutaminolysis[43]. K-Ras reprograms glutamine utilization under low glutamine levels, and MyeloCytomatosis (MYC) regulates glutamine metabolism and uptake[48]. However, considering that glutamate synthase is not highly expressed in all tissues, metabolic glutamine dependency is characteristic of the metabolic profile of cancer cells[43].
A bulk of evidence demonstrates that solid tumors are highly disorganized[49], which results from an accumulation of mutations and can lead to changes in their signal transduction, proliferative rates, and metabolic status[50]. Comparative studies on the metabolic profile of different tumor types have demonstrated enormous variability in the metabolic needs among cancer cells.
Assessment of the metabolic signature of ovarian and colon cancer cell lines demonstrated higher levels of glucose-6-phosphate and mannose-6-phosphate in ovarian than in colon cancer cell lines, which was accompanied by increased levels of TCA intermediates, such as succinate, fumarate, malate, isoleucine, valine, and tyrosine. On the other hand, colon cancer cell lines showed increased levels of lactate, isovalerylcarnitine, and isobutiyrilcarnitine (degradation products of isoleucine and valine, respectively)[7].
Hu et al.[51] compared the metabolic profiles of different tumor cell lines using MS. The distinct metabolic profile of each cell line was characterized by a unique phenotype. For example, analysis of the culture media revealed that both renal (RCC) and ovarian (SKOV3) tumor cells released high concentrations of phenylalanine, tyrosine, glycine, glutamine, alanine, valine, isoleucine, leucine, glucose, pyruvate, and succinate. However, intracellular analysis showed high glutamate concentrations in both RCC and SKOV3 cells, compared with those in other cells. Furthermore, lung cancer cells (A549) released higher concentrations of lactate but lower alanine levels, whereas brain tumor cells (H4) released high levels of serine, methionine, threonine, valine, glycine, and acetate[51].
It has been proposed that the tumor grade and overall survival in patients with estrogen-positive (ER+) breast cancers are correlated with the glutamine to glutamate ratio in tumor tissues, confirming the potential of metabolites as biomarkers of tumor progression[52]. Accordingly, metabolomics revealed individual metabolic signatures for different subsets of breast cancer cell lines; glycine and alanine levels were higher MDA-MB-453 cells (ER-, PR-, HER2+) than in MDA-MB-231 (ER-, PR-, HER2-) and BT-474 (ER-, PR+, HER2+) cells[53]. Elevated levels of TCA intermediates were found in MDA-MB-453 cells, whereas elevated levels of ribose-5-phosphate were found in MDA-MB-231 cells. Glucose consumption was increased in MDA-MB-231 and MDA-MB-453 cells but not in BT-474 cells, which exhibited lower levels of intracellular lactate[53]. These findings confirm that elevated glucose consumption correlates with increased tumor aggressiveness[45]. Additionally, several studies conducted to identify breast cancer metabolites have shown high levels of phenylalanine, N-acetyl cysteine[54,55], and glucose[55,56] and low levels of histidine[55-57] in most cell types.
Melanoma metabolic reprogramming has been associated with the oncogenotype and tumor progression. High expression of mutant BRAF leads to enhanced glycolysis in melanomas compared with glycolysis in BRAF wild-type tumors[58]. Furthermore, slow-cycling melanoma cells show elevated OXPHOS, while highly proliferative cells are glycolysis-dependent[59]. Interestingly, Shu and colleagues demonstrated that melanoma cancer cells could reprogram cancer-associated fibroblasts (CAFs) toward increased aerobic glycolysis and decreased OXPHOS through miRNAs within melanoma-derived exosomes[60]. Fedele et al.[61] showed that the progression of B16F10 melanoma cells is associated with changes in choline phospholipid metabolism, enabling invasion and metastasis. Additionally, studies on melanoma exosomes have provided clues to their capacity of redirecting the host’s metabolic programming to favor the less efficient anaerobic glycolytic pathway over OXPHOS for the production of ATP[62].
Altogether, these findings demonstrate that metabolomics can detect and differentiate the metabolic profile of cancer cells, contributing evidence of how tumor cells affect their surrounding microenvironment and vice versa. Within the tumor microenvironment, stromal cells, including fibroblasts, endothelial, and immune cells, can replenish metabolism in tumor cells mainly by aerobic glycolysis[63]. This represents a two-way mechanism in which tumor metabolites affect stromal cells that can replenish anaplerotic metabolism in tumor cells. Table 1 highlights the metabolic pathways linked to cancer-associated inflammation in different cell types.
Metabolic signatures of cancer and cancer-associated inflammatory cells
| Cell type | Metabolic changes | Modulated cellular function | Ref. |
|---|---|---|---|
| Ovarian vs. colon cancer cell lines | Higher levels of glucose-6-phosphate, mannose-6-phosphate, succinate, fumarate, malate, isoleucine, and valine in ovarian cell lines
Higher levels of lactate, isovalerylcarnitine, and isobutiyrilcarnitine in colon cancer cell lines | Improved de novo synthesis and elongation of fatty acids
Supply of fatty acids to mitochondria for β-oxidation | [7] |
| MDA-MB-231 and MDA-MB-453 breast cancer cell lines | High glucose consumption | Increased tumor aggressiveness and poor prognosis in patients. | [53] |
| BRAF mutant vs. BRAF wild-type melanoma | Enhanced glycolysis | Increased proliferation | [58,59] |
| Melanoma cancer cells | Released exosomes enriched with miRNA | Reprograming of CAFs toward increased aerobic glycolysis and decreased OXPHOS | [60] |
| B16F10 melanoma cancer cells | Changes in choline phospholipid metabolism | Increased invasion and metastasis | [61] |
| CAFs | Harnessing of carbon and nitrogen from glucose/lactate and BCAA, respectively, to synthesize glutamine
Released exosomes enriched with amino acids, lipids, and TCA intermediates Release of lactate | Glutamine supply for ovarian tumor cells
Support of tumor growth Lactate is metabolized by prostate cancer cells via the “reverse Warburg effect” | [81]
[82] [84,85] |
| Pancreatic CAFs | Release of alanine | Macromolecular biosynthesis in pancreatic cancer cells | [86] |
| Breast and colon cancer cells | Release of lactate | Lactate is metabolized by surrounding CAFs and mesenchymal stem cells | [81,86] |
| Cancer cells and TAMs | Depletion of tryptophan and arginine from the tumor microenvironment | Suppression of T cell responses and impaired recognition of cancer cells by the immune system | [88-91] |
| TAMs | Competition with tumor cells for glucose | Changes in glucose metabolism toward aerobic glucose | [106-109] |
| Educated TAMs from MV3 cell-conditioned media | Increased biosynthesis and storage of fatty acids
Increased expression of genes related to glutamate transport and metabolism Increased glycolytic flow | Increased COX-2 expression and PGE2 production, allowing tumor development
Increased consumption of glutamine by TAMs Lactate secretion and increased ATP production by OXPHOS | [109]
[169] [106] |
| TANs | Deprivation of glucose
Abundance of ornithine, spermidine, and proline Enrichment of the glutathione synthesis pathway Upregulation of fatty acid transport protein 2 (FATP2) | Engagement in mitochondrial metabolism
Tissue repair and cell proliferation Enhanced antioxidant capacity Uptake of arachidonic acids and synthesis of prostaglandin E2, supporting tumor growth and immune escape | [128]
[129] [129] [129] |
| Prostate cancer cells | Enhancement of MYC transcriptional program during obesity | De novo synthesis of fatty acids, and increased expression of ATP citrate lyase, acetyl-CoA carboxylase, and fatty acid synthase | [150] |
| Preadipocytes from the pancreatic microenvironment | Supply of glutamine to pancreatic cells | Increased survival | [151,152] |
| Adipose stromal cells from the ovarian microenvironment | Supply of fatty acids to ovarian cancer cells | Increased tumor growth | [156] |
| Breast cancer cells educated with adipocytes | Mobilization of fatty acids from adipocytes | Modest increase in proliferation and migration | [157] |
| Hepatic stellate cells | Increased COX-2 expression and local production of PGE2 by obese dysbiotic microbiota-derived metabolites | Suppression of antitumoral response and tumor progression | [158] |
Metabolic interactions in the tumor microenvironment
The tumor microenvironment is a prime example of metabolic disorder in which cells surrounding the tumor can compromise or withstand the high metabolic demand of tumor cells by competing for nutrients or forming metabolic symbiosis, as shown in Figure 1. As a product of aerobic or anaerobic glycolysis, lactic acid produced by tumor cells has a critical function in macrophage signaling. This metabolite can induce vascular endothelial growth factor expression and polarization of macrophages present in the tumor microenvironment toward an immunosuppressive M2 phenotype. This effect of lactic acid is mediated by HIF-1α, demonstrating an interplay between the metabolism of tumor cells and the modulation of the inflammatory tumor microenvironment[64]. On the other hand, there is no evidence that tumor-derived metabolites influence the functional phenotype of neutrophils. The only tumor cell-derived factor described to modulate neutrophil function is the transforming growth factor (TGF)-b, which switches neutrophils to an N2 phenotype[65].
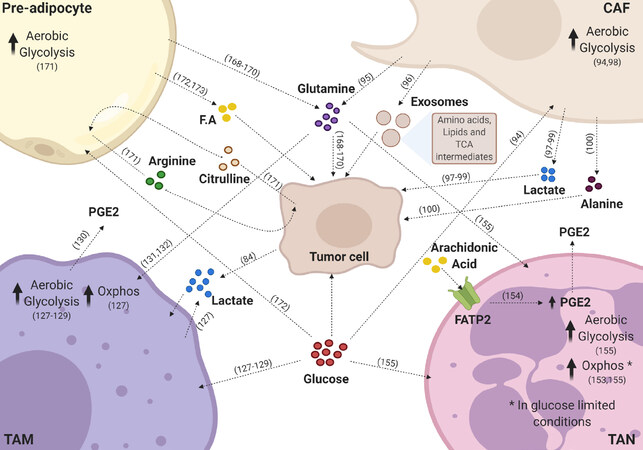
Figure 1. Key metabolic pathways sustaining the tumor microenvironment. Tumor cells receive different metabolites from the tumor microenvironment. Inflammatory cells release various metabolites to the microenvironment that are taken up by tumor cells or other stroma cells. Tumor associated-macrophages (TAMs) release prostaglandin E2 (PGE2) and high amounts of lactate; tumor associated-neutrophils (TAN) also release PGE2 to the microenvironment. Pre-adipocytes release glutamine, fatty acids (F.A), and arginine through the uptake of citrulline. Cancer-associated fibroblasts (CAFs) secrete glutamine, alanine, high amounts of lactate, exosomes containing amino acids, lipids, and intermediates of the tricarboxylic acid (TCA) cycle, which are taken up by tumor cells. Lactate present in the tumor microenvironment is taken up by macrophages and tumor cells. Glutamine can be taken up by macrophages, neutrophils, and tumor cells. Glucose, when available, is used by most of the cells present in the microenvironment. All these metabolite exchanges contribute to the protumor phenotype of the tumor microenvironment. This figure was created with BioRender (www.biorender.com)
One of the mechanisms that allows tumors to escape from immune surveillance is the shift in tumor-derived metabolites accumulated in the tumor microenvironment[66]. For example, high concentrations of extracellular lactate may affect tumor and stroma cells, driving metabolic reprogramming[67,68] and inflammation[13]. Lactate has immunosuppressive effects on T and NK cells[69] and drives macrophages toward an immunosuppressive phenotype in the tumor microenvironment[64]. Additionally, it was shown in mouse models that glucose consumption by melanoma cells limited their availability to T cells, thereby dampening their effector activity[70].
Nutrient and oxygen access within the tumor microenvironment is proportional to vascular access, and the proximity of tumor microenvironment to the vasculature promotes tumor metabolic heterogeneity[71]. Thus, poor perfusion may result in acidification of tumors (pH 6.5-6.9 vs. pH 7.2-7.5 in normal tissues)[72,73]. Cancer cells set the tumor microenvironment to their benefit[74]. To counteract metabolic challenges, metabolites rely on cross-feeding pathways to promote bioenergetics and biosynthesis[71]. The remarkable metabolic plasticity of tumor cells allows them to adapt to changes in environmental conditions, such as nutrient conditions, and to maintain their proliferative rates[75,76].
This adaptation can further modify tumor microenvironment[74]. Oncogenes can modulate tumor utilization of glucose and other fuels to sustain growth and tumor progression[77]. Furthermore, tumor activity metabolically reprograms stromal components; for example, CAFs lower their contractility and augment their extracellular matrix remodeling activity, survival potential, and proliferation[78,79], which are sustained by a switch from OXPHOS to aerobic glycolysis[80]. Yang et al.[81] reported that CAFs harness carbon from several sources to fuel ovarian tumor cells with glutamine, even when glutamine is scarce. In this context, 13C-isotope-labeling experiments showed that CAF-derived exosomes supply cancer cells with intact metabolites, such as amino acids, lipids, and TCA intermediates, thereby supporting tumor growth[82]. Furthermore, CAFs release lactate, which is metabolized by prostate cancer cells[83] by the so-called “reverse Warburg effect”[84,85]. There are further CAF-tumor cell interactions; for example, breast and colon tumor cells release lactate as a metabolite of glucose consumption to surrounding CAFs and mesenchymal stem cells[81,86].
Several studies have revealed metabolic crosstalk within the tumor microenvironment. Pancreatic CAFs secrete alanine, which replenishes macromolecular biosynthesis in pancreatic cancer cells[86]. Non-solid tumors, lymphoid leukemia, and bone marrow stromal cells transform cystine to cysteine, enabling its transportation into cancer cells by amino acid transporters[87]. The close relationship between cancer and immune cells within the microenvironment is associated with amino acid metabolism. For example, cancer cells and tumor-associated macrophages (TAMs) deplete tryptophan and arginine from the tumor microenvironment, leading to a lack in the supply of these metabolites to T cells and thus to the impairment in the recognition of cancer cells by the immune system[88-91].
Macrophages
Macrophages present in the tumor microenvironment (i.e., TAMS) play a dominant role as orchestrators of cancer-related inflammation[92,93]. In the tumor microenvironment, TAMs can affect neoplastic tissues in different ways. Studies have demonstrated that TAMs, according to their activation state, can promote or inhibit the proliferation of tumor cells[94,95].
These opposing roles are due to the different phenotypic polarity of macrophages, which are often classified as immunosuppressive M2 macrophages that promote tumor progression or pro-inflammatory M1 macrophages that enforce antitumor immunity[96]. This differential activation of macrophages is critically supported by intracellular metabolic changes that are linked to multiple aspects of these cells. The regulation of these changes controls the appropriate activation of macrophages, resulting in different phenotypes[97-99].
M1 and M2 macrophages
Classically activated M1 macrophages play important pro-inflammatory and antitumor roles. This M1 profile is characterized by the production of pro-inflammatory factors, such as interleukin (IL)-6, IL-12, IL-23, and tumor necrosis factor-alpha (TNF-α), and the efficient production of ROS and nitric oxide (NO)[96]. Specific metabolic changes support this pro-inflammatory M1 profile. Studies have shown that glucose consumption in lipopolysaccharide-activated macrophages supports high rates of aerobic glycolysis, Warburg metabolism, and lactate production regardless of the oxygen concentration present[98]. The high glycolytic metabolism in M1 not only produces ATP to support its secretory and phagocytic functions but also feeds the PPP. Together, these pathways support the response of inflammatory macrophages and the generation of amino acids for protein synthesis, ribose for nucleotide synthesis, NADPH for ROS synthesis via the NADPH oxidase system, and NO via inducible NO synthase[50,100,101]. Consistent with this, a metabolomics study demonstrated that the activation of human monocyte-derived macrophages resulted in intracellular metabolic adaptations associated with GSH. M1 macrophages showed low levels of intracellular GSH and NADPH. These data indicate that M1 macrophages consume NADPH, possibly to generate substantial levels of ROS, which is characteristic of the M1 phenotype. Increased taurine levels found in M1 may compensate or neutralize excessive or harmful ROS production[102].
Besides that, the TCA cycle in M1 macrophages has two “breaks”, leading to the alteration of glucose oxidation with profound consequences for the activation of this phenotype[103]. The first break occurs at isocitrate dehydrogenase 1, which regulates the destination of citrate, and leads to the accumulation of citrate in the mitochondria. When accumulated, citrate is used as a precursor for the synthesis of fatty acids and phospholipids required to expand the endoplasmic reticulum and the Golgi complex, which is important to accommodate the increased amount of inflammatory cytokines[104].
This citrate accumulation and positive regulation of the immunoresponsive gene 1 protein, an enzyme with decarboxylase activity, leads to the production of itaconate. In addition to having microbicide capabilities, this metabolite competitively inhibits succinate dehydrogenase, leading to the second break in the TCA cycle[105]. Since succinate dehydrogenase is a subunit of complex II of the electron transport chain, the production of itaconate disrupts the activity of the chain and oxidative metabolism, leading to the accumulation of succinate[99].
Anti-inflammatory M2 macrophages are associated with tissue repair, angiogenesis, and T helper type 2 immunity. Unlike M1, M2 shows low rates of glycolysis but high rates of fatty acid oxidation and OXPHOS. Although the glycolytic flow is less intense in these cells, is of fundamental importance for feeding the TCA cycle and supporting mitochondrial respiration[104].
In contrast to M1 macrophages, M2 macrophages decrease the flow of PPP through the positive regulation of sedoheptulose kinase. This kinase decreases the flow of oxidative PPP by catalyzing the formation of sedoheptulose-7-phosphate, a PPP inhibitor. It is believed that M2 macrophages reduce the flow of PPP because the activities of the main inflammatory regulators may be sensitive to the redox state[101].
Another important metabolic feature of M2 macrophages is their capacity to increase the consumption of glutamine, enabling the biosynthesis of UDP-N-acetylglucosamine (UDP-GlcNAc), which is required for the glycosylation of proteins. The biosynthesis of UDP-GlcNAc is mediated by the hexosamine pathway, a glycolytic shunt. Inhibition of this process leads to a decrease in the expression of M2 markers because receptors characteristic of M2 macrophages, such as lectin/mannose receptors, are highly glycosylated[104]. Consistently, in a study employing transcriptomics and metabolomics, the inhibition of N-glycosylation or the hexosamine pathway reduced the expression of N-glycosylated markers, such as CD206 and CD301, on the cell surface of M2, emphasizing the importance of glutamine-dependent pathways in M2 macrophages[99]. In addition, glutamine replenishes the TCA cycle activity through anaplerosis and thereby promotes OXPHOS[104].
The use of metabolomics is essential for defining the specific metabolic signatures of each macrophage profile. In a study by Fuchs et al.[102] employing monocyte-derived macrophages, macrophage activation states were distinguishable based on their intracellular and extracellular metabolite profiles. Increased concentrations of intracellular metabolites, such as ATP, niacinamide, quinolinate, phosphoethanolamine, choline, and taurine, were found in M1 macrophages, whereas increased concentrations of ADP, GTP, AMP, and L-acetylcarnitine were detected in M2 macrophages. In addition, M1 macrophages showed increased levels of other metabolites, such as choline, 2-hydroxybutyrate, glutamine, proline, and lactate, whereas M2 macrophages showed increased levels of fumarate, arabinose, aspartate, glutamate, and pyruvate. These results support the notion that elevated glycolytic flux and lactic acid fermentation are key markers of M1 macrophages when compared with M2 macrophages.
TAMs
The metabolic profile of TAMs is very dynamic. TAMs are not only affected by the tumor microenvironment but also modulate the metabolism of the whole tumor microenvironment. Recent studies suggest that TAMs are forced to compete with tumor cells for nutrients, especially glucose, and therefore undergo changes in their glucose metabolism in a similar way to tumor cells. Only a few studies indicate that TAMs activate aerobic glycolysis, contributing to their functional reprogramming[106-108].
Besides changes in glucose metabolism, TAMs also show changes in lipid metabolism by increasing the biosynthesis and storage of fatty acids[109]. These changes have been associated with functional reprogramming, although the mechanisms remain unknown. Several studies have shown that TAMs exhibit changes in arachidonic acid metabolism, as evidenced by an increased expression of cyclooxygenase-2 (COX-2) and the consequent increase in prostaglandin E2 (PGE2) production, which is important for tumor development. This suggests that, after tumor development, not only tumor cells but also immune cells, such as macrophages, increase the synthesis of prostaglandins[109].
Similar to M2 macrophages, pro-tumorigenic TAMs show an increased consumption of glutamine. This increased glutamine consumption is associated with high levels of UDP-GlcNA required for the N-glycosylation of receptors associated with M2 and TAMs, such as CD206 and CD301. Consistently, a previous study demonstrated that TAMs exposed to glioblastoma cells show an increased expression of genes related to glutamate transport and metabolism.
However, recent studies employed in vitro cell culture models using immortalized murine and human cell lines and bone marrow-derived murine macrophages, while comparable metabolomics studies on physiologically relevant human macrophage populations, such as primary human monocyte-derived macrophages, are lacking. Using a macrophage model derived from human monocytes, our group demonstrated that TAMs educated by melanoma cell line (MV3)-conditioned medium share metabolic characteristics with M1 and M2 macrophages (i.e., increased glycolytic flow, leading to high lactate secretion and ATP production by OXPHOS)[106]. The high uptake of glucose and subsequent lactate secretion was confirmed by NMR-based metabolomics (data not published).
Thus far, information about the metabolic profile of TAMs (i.e., their intrinsic relationship with tumor functions) is still lacking. Therefore, metabolomics techniques are essential for the understanding of metabolic pathways that support the TAM phenotype.
Neutrophils
Neutrophils are the most abundant leukocytes in human peripheral blood, accounting for about 60% of all leukocytes in the circulation. Produced in the bone marrow, neutrophils are released as terminally differentiated cells under normal conditions[110,111]. Once in the circulation, neutrophils can be recruited to inflammatory sites to remove invading microorganisms mainly through phagocytosis, the release of cytotoxic enzymes (degranulation), ROS production, and neutrophil extracellular traps (NETs) formation[112,113]. Several solid tumors recruit neutrophils to the tumor microenvironment, and the ratio of neutrophils to lymphocytes is usually correlated with poor prognosis, indicating the pivotal role of these cells in tumor progression[114]. Indeed, tumor-associated neutrophils (TANs) have been implicated as key players in malignant transformation, tumor progression, and antitumoral immunity[112]. Similar to the M1/M2 dichotomy of macrophages, neutrophils display functional heterogeneity and plasticity that can be shaped by the surrounding microenvironment. N1 neutrophils present a pro-inflammatory and antitumor phenotype with hypersegmented nuclear morphology and release pro-inflammatory mediators, such as macrophage inflammatory protein-1 alpha, TNF-a, H2O2, and NO, inducing tumor cell cytotoxicity in vitro and in vivo[115]. On the other hand, N2 neutrophils present a protumor phenotype characterized by the upregulation of various chemokines, such as chemokine (C-C motif) ligands (CCLs) 2, 3, 4, 8, 12, and 17 and chemokine (C-X-C motif) ligands (CXCLs) 1, 2, 8, and 16. N2 neutrophils support tumor progression, metastasis, and angiogenesis[116]. N2 polarization is promoted by the immunosuppressive cytokine TGF-b, which is highly expressed in several solid tumors[65,116], and countered by interferon (IFN)-γ and TNF-a as they convert N2 neutrophils to the N1 phenotype[117]. While the metabolic requirements for macrophage polarization have been recently documented, the metabolic phenotype of neutrophils and TANs remains undefined.
Historically, neutrophils are believed to depend exclusively on glycolytic metabolism. This assumption is based on several studies dating back as early as 1912 when Levene and Meyer reported that activated neutrophils preferentially convert glucose into lactic acid[118]. Additionally, more recent studies have shown that neutrophils contain only a few functional mitochondria with limited contribution to ATP production and a role restricted to apoptosis[119]. However, these studies were all conducted in the presence of glucose and oxygen. Given the high glycolytic phenotype of cancer cells, which generates a low-glucose and high-lactate/acidic microenvironment associated with hypoxic areas inside the tumor mass, it is intuitive to think that TANs are endowed with a more versatile cellular metabolism.
In resting neutrophils, ATP is mainly produced by glycolysis. Extracellular glucose is transported into human neutrophils via glucose transporter 1 (GLUT1), the basal expression of which can be upregulated in glucose-rich environments[120]. Human neutrophils also express GLUT3 and GLUT4, which are also upregulated upon activation by phorbol 12-myristate 13-acetate (PMA)[120-122]. In rats, GLUT4 is also upregulated by the platelet-activating factor (PAF)[122]. Both PMA and PAF trigger a pro-inflammatory response in neutrophils, which is characteristic of the N1 phenotype. Intracellular glucose is immediately phosphorylated by hexokinase to form glucose-6-phosphate[123]. Depending on cellular demands, glucose-6-phosphate can be metabolized by the glycolytic pathway or PPP[124]. Through glycolysis, each glucose-6-phosphate molecule will lead to the production of two molecules of pyruvate, two molecules of ATP, and two molecules of NADH. In most cells under aerobic conditions, pyruvate is then oxidized in the mitochondria through the TCA cycle. However, in neutrophils, pyruvate is converted into lactate, which enables the regeneration of NAD+ essential for the continuity of glycolysis[119,124,125].
PPP, which is also known as the hexose monophosphate shunt, is required for several neutrophil functions[126]. PPP encompasses an oxidative and non-oxidative phase. During the oxidative phase, glucose-6-Phosphate dehydrogenase (G6PD), 6-phosphogluconolactonase, and 6-phosphogluconate dehydrogenase convert glucose-6-phosphate into CO2, ribulose-5-phosphate, and NADPH. PPP is particularly important to neutrophils because it provides NADPH to support the NADPH oxidase-dependent production of ROS[123]. Inhibition of G6PD in neutrophils under high glucose concentrations reduces superoxide production[124]. This metabolic shift was recently confirmed by NMR metabolomics; the authors identified alterations in 43 of the 110 assigned metabolites, suggesting that virtually all the glucose was diverted to the PPP in response to PMA stimulation[126].
The evidence of glycolytic metabolism, together with their small number of mitochondria and the limited contribution of mitochondrial metabolism to overall ATP production, leads to the assumption that neutrophils do not engage mitochondrial metabolism. However, the description of different neutrophil activation states, with similarities to M1 and M2 macrophages[65], and the preference of M2 macrophages for oxidative metabolism[127] raised the possibility that neutrophils also exhibit other metabolic phenotypes.
In fact, a few recent studies support the idea that mitochondrial oxidative metabolism plays a role in neutrophils, especially in cancer and TAN models. These cells display functional and phenotypic similarities to M2 macrophages, which rely on oxidative metabolism. Using 4T-1 tumor-bearing mice, Rice and colleagues recently demonstrated that TANs and neutrophils isolated from cancer patients can engage mitochondrial metabolism, especially when deprived of glucose[128]. In addition, in the same work, metabolomics showed that neutrophils from tumor-bearing mice displayed a significant abundance of polyamine-related metabolites, such as ornithine, spermidine, and proline, which are associated with tissue repair and cell proliferation.
In a subsequent study, Veglia and colleagues demonstrated that fatty acid transporter protein 2 (FATP2) is fundamental for fatty acid transport by tumor-associated neutrophils. More specifically, these cells take up arachidonic acid for PGE2 synthesis, which supports their pro-tumoral function[129]. However, the metabolic difference between antitumor N1 neutrophils and protumor N2 neutrophils is not their dependence on glycolysis and oxidative metabolism, respectively, but their metabolic plasticity; that is, their capacity to use or not use different metabolic substrates. In this respect, TANs were shown to be able to use either glucose or glutamine to support their functions[130]. Similar to N1 neutrophils, these TANs preferentially use glucose, but under glucose-deprived conditions, they can use glutamine to support ROS production and NET release[130]. Altogether, these studies suggest that TANs are metabolically flexible and can use glucose (preferentially), glutamine, or fatty acids. This poses a challenge in translating these findings into clinics because this metabolic flexibility makes TANs more resistant to therapeutic strategies that target metabolic pathways. Conversely, this flexibility enables TANs to survive even under metabolically stressful environments induced by tumor cells, in which an intense nutritional competition takes place[130].
Macrophage and neutrophil metabolism as a potential therapeutic target for cancer therapy
The growing discoveries in the field of immunometabolism, such as the metabolism of macrophages and neutrophils, can provide new therapeutic opportunities to treat cancer[131-133] and other diseases that involve a high number of inflammatory cells[134,135].
During tumor development, macrophages and neutrophils present in the tumor microenvironment are exposed to several specific factors, such as disturbed oxygen and nutrient availability, which direct their functionality and metabolism. Thus, technologies for analyzing the metabolism of these cells are essential to push cancer research forward.
The ideal outcome would be to find metabolic targets that do not positively affect the disease. Using MS/MS, Halbrook et al.[133] demonstrated that TAMs release a panel of pyrimidine nucleosides, including deoxycytidine, which may be involved in chemoresistance to therapies that use nucleoside-like drugs such as gemcitabine. Wenes and colleagues demonstrated that, under hypoxic conditions, TAMs positively regulate the REDD1 (regulated in the development and response to DNA damage 1) protein, which inhibits mammalian target of rapamycin (mTOR) and subsequently inhibits glycolysis, leading to an increased angiogenic response. On the other hand, REDD1-deficient TAMs can compete with neighboring endothelial cells for glucose by activating mTOR and increasing glycolysis, leading to the normalization of the vascular structure and less metastasis[135]. These results suggest that the favorable effects of antitumor drugs, such as mTOR inhibition[132], are partly offset by the deleterious effects of these drugs on TAMs. Our group demonstrated that lipoxin, a pro-resolving lipid mediator, decreased the levels of M2 markers in TAMs and thereby induced an antitumor M1-like phenotype in vitro and in vivo[136,137]. Moreover, using NMR-based metabolomics, our group showed that TAMs treated with lipoxin had decreased levels of GSH and an exometabolomic profile close to that of M1 macrophages. Lipoxin treatment does not seem to alter the glycolytic metabolism of TAMs, thereby maintaining glucose availability (data not published).
Glutamine levels also play an important role in regulating inflammation and are therefore becoming a therapeutic target in cancer treatment. Palmiere and colleagues reported that the pharmacologic inhibition of glutamine synthetase, an enzyme that synthesizes glutamine from glutamate, induced a switch in M2-like TAMs toward an M1-like phenotype by reducing the intracellular level of glutamine and inducing succinate accumulation and glycolysis. These metabolic changes in TAMs increased their capacity to induce T cell recruitment and reduced their T cell suppressive potential, cancer cell motility, and metastasis, highlighting the role of metabolism rewiring as a way to manipulate macrophage functions in a cancer context[138]. In addition, untargeted MS/GC analysis revealed that itaconic acid is highly upregulated in peritoneal tumor tissue-resident macrophages, indicating that this metabolite is a potential therapeutic target[139]. Neutrophils may also be metabolically targeted by cancer therapeutics, as exemplified by the study from Veglia and colleagues[129]: interference with the lipid import by FATP2 inhibition resulted in decreased tumor growth, indicating that FATP2 is a potential therapeutic target. However, the available data on tumor-associated neutrophils suggest a dynamic metabolic plasticity for neutrophils that may endow these cells with the capacity to overcome the pharmacological intervention of a single metabolic pathway. These findings emphasize the need for a better understanding of the metabolism of cells present in the tumor microenvironment to develop new therapies that effectively control cancer.
Obesity, metabolic alterations, and tumor microenvironment
Obesity is considered a leading preventable risk for cancer[140]. A retrospective analysis of more than 1000 studies revealed that the increase in body fat is correlated with an increased risk of 13 different cancer types (out of 24 evaluated cancer types)[141]. This close relationship between obesity and tumor malignancy is a result of dysbiosis and inflammation due to hypertrophic and hypoxic adipose tissues[142]. Among the mechanisms that contribute to obesity-induced carcinogenesis are nutrient-sensitive pathways, such as insulin/insulin-like growth factor 1, phosphatidylinositol-3 kinase, protein kinase B, and mTOR. These pathways drive cell proliferation, angiogenesis, and glycolysis, and anti-apoptotic pathways that play a role in tumorigenesis and increased metastasis, mediating integrated crosstalk within the microenvironment[143,144]. The presence of crown-like structures (CLS) in white adipose tissue correlates with metabolic dysfunction[145]. In patients with cancer, CLS have been associated with worse outcomes. Histology reveals that CLS are present in ~ 50% of women with breast cancer and associated with higher body mass index, higher aromatase levels[146], distant recurrence, and mortality[147]. In addition, a study on prostate cancer demonstrated that CLS in prostate fat cells were associated with higher tumor grade[148]. Macrophages accelerate breast cancer growth by exhausting T cells, which possibly contributes to an immunosuppressive microenvironment and a worse prognosis[149]. It seems that these macrophages present in mammary adipose tissue co-express M1 and M2 markers, leading to a mixed phenotype[142]. Systemic metabolic alterations in obesity and the consumption of saturated fat are linked to prostate cancer and mortality due to the enhancement of the oncogenic MYC transcriptional program, which plays a pivotal role in human prostate tumorigenesis. In this regard, cancer progression is exacerbated by a high-fat diet[29]. Notably, MYC drives the de novo synthesis of fatty acids and increases the expression of ATP citrate lyase, acetyl-CoA carboxylase, and fatty acid synthase[150].
The supply of glutamine to pancreatic cancer cells by preadipocytes (adipocyte precursor cells) enhances the survival and growth of pancreatic cancer cells[151-153]. These data are consistent with those of other studies showing that adipocyte accumulation in pancreatic ductal adenocarcinoma generates a pro-inflammatory and pro-fibrotic microenvironment, promoting cancer progression and resistance to chemotherapy[154]. Adipose stromal cells in the ovarian microenvironment have also been shown to engage in a symbiotic metabolism pathway with ovarian cancer cells via arginine metabolism[155]. Ovarian cancer cells preferentially metastasize to the omentum, a tissue rich in adipocytes, which provides fatty acids to ovarian cancer cells to facilitate tumor growth[156]. Similarly, in breast cancer co-culture models, cancer cells promoted the mobilization of fatty acids from adipocytes, causing modest pro-proliferative and pro-migratory effects[157]. In addition, Loo et al.[158] demonstrated that dysbiosis in obesity is associated with hepatocellular carcinoma. Their results indicate that the microbial metabolites dichloroacetate and lipoteichoic acid translocate to the liver (gut-liver axis) and collaboratively promote the expression of senescence-associated secretory phenotype factors and COX-2 through the toll-like receptor 2 in hepatic stellate cells in obesity-associated liver tumors. This, in turn, promotes the local production of PGE2, which suppresses the antitumoral immune response, facilitating tumor progression[158].
Metabolomics as a tool for cancer diagnostic
Metabolomics is a promising tool for cancer diagnostics. For example, high-resolution magic angle spinning (HR-MAS) NMR methodology allows the analysis of intact biopsy tissues without any chemical extraction and can be directly linked to a surgery room[159]. HR-MAS NMR coupled with GC/MS allowed the discrimination of biopsied colorectal tumors from their matched normal mucosal tissues collected from 31 colorectal cancer patients[160]. HR-MAS NMR rapidly distinguished rectal from colon cancers and differentiated metabolic profiles associated with different T-stages[161]. The levels of choline-associated metabolites obtained by HR-MAS NMR can be used to distinguish breast tumor from non-tumor tissues[162,163]. Using metabolomics, Tripathi et al.[164] observed that elevated levels of alanine, glutamine, glutamate, branched-chain amino acids, tyrosine, and phenylalanine are highly correlated with bladder cancer and early-stage tumor (Ta-T1). In addition, a recent study combining HR-MAS NMR with magnetic resonance imaging identified taurine, cystathionine, 2-aminoadipate, and 2-hydroxyglutarate as biomarkers for glioma grading[165].
Conclusion
Metabolic reprogramming is a hallmark of cancer, contributing to tumorigenesis and the malignant phenotype. The growing interest in immunometabolism will further the development of new therapeutic opportunities to treat inflammatory diseases and cancer. Understanding the metabolic changes in tumor and stromal cells remains an imperative task for predicting treatment responsiveness and developing novel therapeutic strategies. In this regard, metabolomics is a helpful tool to study cancer from a unique perspective and a valuable analytical technique to elucidate the mechanisms of cancer therapies. Additionally, metabolomics is a valuable tool for cancer diagnostics and provides avenues to find new and more accurate biomarkers. Recently, new standard protocols have been established to facilitate metabolomics-based construction of personal metabolic phenotypes based on complex connections involving diet, gut microbiome, genotype, drugs, age, gender, and lifestyle. By providing individual metabolic profiles, metabolomics has become a key omics in clinical precision medicine, especially cancer-related medicine[166-169].
Declarations
Authors’ contributionsOrganized and wrote the final review: dos Santos GC, Barja-Fidalgo C
Reviewed the paper: Saldanha-Gama R, de Brito NM, Renovato-Martins M
Designed the figure: de Brito NM
Designed the table: Renovato-Martins M
Availability of data and materialsNot applicable.
Financial support and sponsorshipNone.
Conflicts of interestAll authors declared that there are no conflicts of interest.
Ethical approval and consent to participateNot applicable.
Consent for publicationNot applicable.
Copyright© The Author(s) 2021.
REFERENCES
1. Honigmann JJ. The human frontier. By Roger J. Williams. Harcourt Brace and Co., New York, viii + 314 pp., references, index, 1946. ($3.00). Am J Phys Anthropol 1947;5:378-9.
2. Gates SC, Sweeley CC, Krivit W, Dewitt D, Blaisdell BE. Automated metabolic profiling of organic acids in human urine. II. Analysis of urine samples from “healthy” adults, sick children, and children with neuroblastoma. Clin Chem 1978;24:1680-9.
3. Oliver SG, Winson MK, Kell DB, Baganz F. Systematic functional analysis of the yeast genome. Trends Biotechnol 1998;16:373-8.
4. Wu H, Southam AD, Hines A, Viant MR. High-throughput tissue extraction protocol for NMR- and MS-based metabolomics. Anal Biochem 2008;372:204-12.
5. Markley JL, Brüschweiler R, Edison AS, et al. The future of NMR-based metabolomics. Curr Opin Biotechnol 2017;43:34-40.
6. Mathew AK, Padmanaban VC. Metabolomics: the apogee of the omics trilogy. Int J Pharm Pharm Sci 2013;5:45-48.
7. Halama A, Guerrouahen BS, Pasquier J, et al. Metabolic signatures differentiate ovarian from colon cancer cell lines. J Transl Med 2015;13:223.
8. Nicholson JK. Global systems biology, personalized medicine and molecular epidemiology. Mol Syst Biol 2006;2:52.
9. Fukui Y, Itoh K. A plasma metabolomic investigation of colorectal cancer patients by liquid chromatography-mass spectrometry. Open Anal Chem J 2010;4:1-9.
10. Odunsi K, Wollman RM, Ambrosone CB, et al. Detection of epithelial ovarian cancer using 1H-NMR-based metabonomics. Int J Cancer 2005;113:782-8.
11. Ben Sellem D, Elbayed K, Neuville A, et al. Metabolomic characterization of ovarian epithelial carcinomas by HRMAS-NMR spectroscopy. J Oncol 2011;2011:174019.
12. Qiu YP, Cai GX, Zhou BS, et al. A distinct metabolic signature of human colorectal cancer with prognostic potential. Clin Cancer Res 2014;20:2136-46.
13. Haas R, Smith J, Rocher-Ros V, et al. Lactate regulates metabolic and pro-inflammatory circuits in control of T cell migration and effector functions. PLoS Biol 2015;13:e1002202.
14. Cuperlović-Culf M, Barnett DA, Culf AS, Chute I. Cell culture metabolomics: applications and future directions. Drug Discov Today 2010;15:610-21.
15. Iorio E, Mezzanzanica D, Alberti P, et al. Alterations of choline phospholipid metabolism in ovarian tumor progression. Cancer Res 2005;65:9369-76.
16. Warburg O, Minami S. Versuche an Überlebendem carcinom-gewebe. Klin Wochenschr 1923;2:776-7.
17. Warburg O, Negelein E, Posener K. Versuche an Überlebendem carcinomgewebe. Klin Wochenschr 1924;3:1062-4.
19. Warburg O, Wind F, Negelein E. The metabolism of tumors in the body. J Gen Physiol 1927;8:519-30.
20. DeBerardinis RJ, Mancuso A, Daikhin E, et al. Beyond aerobic glycolysis: transformed cells can engage in glutamine metabolism that exceeds the requirement for protein and nucleotide synthesis. Proc Natl Acad Sci U S A 2007;104:19345-50.
21. Lafita-Navarro MC, Perez-Castro L, Zacharias LG, Barnes S, DeBerardinis RJ, Conacci-Sorrell M. The transcription factors aryl hydrocarbon receptor and MYC cooperate in the regulation of cellular metabolism. J Biol Chem 2020;295:12398-407.
22. Rodrigues MF, Obre E, de Melo FH, et al. Enhanced OXPHOS, glutaminolysis and β-oxidation constitute the metastatic phenotype of melanoma cells. Biochem J 2016;473:703-15.
23. LeBleu VS, O’Connell JT, Gonzalez Herrera KN, et al. PGC-1α mediates mitochondrial biogenesis and oxidative phosphorylation in cancer cells to promote metastasis. Nat Cell Biol 2014;16:992-1003. 1-15
24. Jitschin R, Hofmann AD, Bruns H, et al. Mitochondrial metabolism contributes to oxidative stress and reveals therapeutic targets in chronic lymphocytic leukemia. Blood 2014;123:2663-72.
25. Bonuccelli G, Tsirigos A, Whitaker-Menezes D, et al. Ketones and lactate “fuel” tumor growth and metastasis: evidence that epithelial cancer cells use oxidative mitochondrial metabolism. Cell Cycle 2010;9:3506-14.
26. Ippolito L, Marini A, Cavallini L, et al. Metabolic shift toward oxidative phosphorylation in docetaxel resistant prostate cancer cells. Oncotarget 2016;7:61890-904.
27. Denise C, Paoli P, Calvani M, et al. 5-fluorouracil resistant colon cancer cells are addicted to OXPHOS to survive and enhance stem-like traits. Oncotarget 2015;6:41706-21.
28. Caro P, Kishan AU, Norberg E, et al. Metabolic signatures uncover distinct targets in molecular subsets of diffuse large B cell lymphoma. Cancer Cell 2012;22:547-60.
29. Labbé DP, Zadra G, Yang M, et al. High-fat diet fuels prostate cancer progression by rewiring the metabolome and amplifying the MYC program. Nat Commun 2019;10:4358.
30. Stenman K, Hauksson JB, Gröbner G, Stattin P, Bergh A, Riklund K. Detection of polyunsaturated omega-6 fatty acid in human malignant prostate tissue by 1D and 2D high-resolution magic angle spinning NMR spectroscopy. MAGMA 2009;22:327-31.
31. Kurhanewicz J, Vigneron DB, Nelson SJ, et al. Citrate as an in vivo marker to discriminate prostate cancer from benign prostatic hyperplasia and normal prostate peripheral zone: detection via localized proton spectroscopy. Urology 1995;45:459-66.
32. Lynch MJ, Nicholson JK. Proton MRS of human prostatic fluid: correlations between citrate, spermine, andmyo-inositol levels and changes with disease. Prostate 1997;30:248-55.
33. Van Der Graaf M, Schipper RG, Oosterhof GON, Schalken JA, Verhofstad AAJ, Heerschap A. Proton MR spectroscopy of prostatic tissue focused on the detection of spermine, a possible biomarker of malignant behavior in prostate cancer. MAGMA 2000;10:153-9.
34. Serkova NJ, Gamito EJ, Jones RH, et al. The metabolites citrate, myo-inositol, and spermine are potential age-independent markers of prostate cancer in human expressed prostatic secretions. Prostate 2008;68:620-8.
35. Thysell E, Surowiec I, Hörnberg E, et al. Metabolomic characterization of human prostate cancer bone metastases reveals increased levels of cholesterol. PLoS One 2010;5:e14175.
36. Schwab A, Siddiqui A, Vazakidou ME, et al. Polyol pathway links glucose metabolism to the aggressiveness of cancer cells. Cancer Res 2018;78:1604-18.
37. Ferretti A, D’Ascenzo S, Knijn A, et al. Detection of polyol accumulation in a new ovarian carcinoma cell line, CABA I: a(1)H NMR study. Br J Cancer 2002;86:1180-7.
38. Xu J, Reznik E, Lee HJ, et al. Abnormal oxidative metabolism in a quiet genomic background underlies clear cell papillary renal cell carcinoma. Elife 2019;8:e38986.
39. Lucarelli G, Galleggiante V, Rutigliano M, et al. Metabolomic profile of glycolysis and the pentose phosphate pathway identifies the central role of glucose-6-phosphate dehydrogenase in clear cell-renal cell carcinoma. Oncotarget 2015;6:13371-86.
40. Lu X, Bennet B, Mu E, Rabinowitz J, Kang YB. Metabolomic changes accompanying transformation and acquisition of metastatic potential in a syngeneic mouse mammary tumor model. J Biol Chem 2010;285:9317-21.
41. Hart CD, Tenori L, Luchinat C, Di Leo A. Metabolomics in breast cancer: current status and perspectives. In: Stearns V, editor. Novel biomarkers in the continuum of breast cancer. Cham: Springer International Publishing; 2016. pp. 217-34.
42. Semenza GL. Regulation of metabolism by hypoxia-inducible factor 1. Cold Spring Harb Symp Quant Biol 2011;76:347-53.
43. Pecqueur C, Oliver L, Oizel K, Lalier L, Vallette FM. Targeting metabolism to induce cell death in cancer cells and cancer stem cells. Int J Cell Biol 2013;2013:805975.
45. Gatenby RA, Gillies RJ. Why do cancers have high aerobic glycolysis? Nat Rev Cancer 2004;4:891-9.
46. Deberardinis RJ, Sayed N, Ditsworth D, Thompson CB. Brick by brick: metabolism and tumor cell growth. Curr Opin Genet Dev 2008;18:54-61.
47. Estrela JM, Ortega A, Obrador E. Glutathione in cancer biology and therapy. Crit Rev Clin Lab Sci 2006;43:143-81.
48. Kim MH, Kim H. Oncogenes and tumor suppressors regulate glutamine metabolism in cancer cells. J Cancer Prev 2013;18:221-6.
49. Egeblad M, Nakasone ES, Werb Z. Tumors as organs: complex tissues that interface with the entire organism. Dev Cell 2010;18:884-901.
50. Nagy C, Haschemi A. Time and demand are two critical dimensions of immunometabolism: the process of macrophage activation and the pentose phosphate pathway. Front Immunol 2015;6:164.
51. Hu C, Liu ZG, Zhao HL, et al. A biochemical comparison of the lung, colonic, brain, renal, and ovarian cancer cell lines using 1H-NMR spectroscopy. Biosci Rep 2020;40:BSR20194027.
52. Budczies J, Pfitzner BM, Györffy B, et al. Glutamate enrichment as new diagnostic opportunity in breast cancer. Int J Cancer 2015;136:1619-28.
53. Willmann L, Schlimpert M, Halbach S, Erbes T, Stickeler E, Kammerer B. Metabolic profiling of breast cancer: differences in central metabolism between subtypes of breast cancer cell lines. J Chromatogr B Analyt Technol Biomed Life Sci 2015;1000:95-104.
54. Oakman C, Tenori L, Claudino WM, et al. Identification of a serum-detectable metabolomic fingerprint potentially correlated with the presence of micrometastatic disease in early breast cancer patients at varying risks of disease relapse by traditional prognostic methods. Ann Oncol 2011;22:1295-301.
55. Jobard E, Pontoizeau C, Blaise BJ, Bachelot T, Elena-Herrmann B, Trédan O. A serum nuclear magnetic resonance-based metabolomic signature of advanced metastatic human breast cancer. Cancer Lett 2014;343:33-41.
56. Tenori L, Oakman C, Claudino WM, et al. Exploration of serum metabolomic profiles and outcomes in women with metastatic breast cancer: a pilot study. Mol Oncol 2012;6:437-44.
57. Asiago VM, Alvarado LZ, Shanaiah N, et al. Early detection of recurrent breast cancer using metabolite profiling. Cancer Res 2010;70:8309-18.
58. Shi XL, Tasdogan A, Huang F, Hu ZP, Morrison SJ, DeBerardinis RJ. The abundance of metabolites related to protein methylation correlates with the metastatic capacity of human melanoma xenografts. Sci Adv 2017;3:eaao5268.
59. Cierlitza M, Chauvistré H, Bogeski I, et al. Mitochondrial oxidative stress as a novel therapeutic target to overcome intrinsic drug resistance in melanoma cell subpopulations. Exp Dermatol 2015;24:155-7.
60. Shu SL, Yang YC, Allen CL, et al. Metabolic reprogramming of stromal fibroblasts by melanoma exosome microRNA favours a pre-metastatic microenvironment. Sci Rep 2018;8:12905.
61. Fedele TA, Galdos-Riveros AC, Jose de Farias e Melo H, Magalhães A, Maria DA. Prognostic relationship of metabolic profile obtained of melanoma B16F10. Biomed Pharmacother 2013;67:146-56.
62. Mears R, Craven RA, Hanrahan S, et al. Proteomic analysis of melanoma-derived exosomes by two-dimensional polyacrylamide gel electrophoresis and mass spectrometry. Proteomics 2004;4:4019-31.
63. Martinez-Outschoorn UE, Pavlides S, Howell A, et al. Stromal-epithelial metabolic coupling in cancer: integrating autophagy and metabolism in the tumor microenvironment. Int J Biochem Cell Biol 2011;43:1045-51.
64. Colegio OR, Chu NQ, Szabo AL, et al. Functional polarization of tumour-associated macrophages by tumour-derived lactic acid. Nature 2014;513:559-63.
65. Fridlender ZG, Sun J, Kim S, et al. Polarization of tumor-associated neutrophil phenotype by TGF-β: “N1” versus “N2” TAN. Cancer Cell 2009;16:183-94.
66. Ohta A, Gorelik E, Prasad SJ, et al. A2A adenosine receptor protects tumors from antitumor T cells. Proc Natl Acad Sci U S A 2006;103:13132-7.
67. Fiaschi T, Marini A, Giannoni E, et al. Reciprocal metabolic reprogramming through lactate shuttle coordinately influences tumor-stroma interplay. Cancer Res 2012;72:5130-40.
68. Choi SY, Collins CC, Gout PW, Wang Y. Cancer-generated lactic acid: a regulatory, immunosuppressive metabolite? J Pathol 2013;230:350-5.
69. Brand A, Singer K, Koehl GE, et al. LDHA-associated lactic acid production blunts tumor immunosurveillance by T and NK cells. Cell Metab 2016;24:657-71.
70. Chang CH, Qiu J, O’Sullivan D, et al. Metabolic competition in the tumor microenvironment is a driver of cancer progression. Cell 2015;162:1229-41.
71. Lyssiotis CA, Kimmelman AC. Metabolic interactions in the tumor microenvironment. Trends Cell Biol 2017;27:863-75.
73. Wike-hooley J, Haveman J, Reinhold H. The relevance of tumour pH to the treatment of malignant disease. Radiother Oncol 1984;2:343-66.
74. Reina-Campos M, Moscat J, Diaz-Meco M. Metabolism shapes the tumor microenvironment. Curr Opin Cell Biol 2017;48:47-53.
77. Hensley CT, Faubert B, Yuan Q, et al. Metabolic heterogeneity in human lung tumors. Cell 2016;164:681-94.
79. Ward PS, Thompson CB. Metabolic reprogramming: a cancer hallmark even warburg did not anticipate. Cancer Cell 2012;21:297-308.
80. Heiden MGV, Cantley LC, Thompson CB. Understanding the Warburg effect: the metabolic requirements of cell proliferation. Science 2009;324:1029-33.
81. Yang L, Achreja A, Yeung TL, et al. Targeting stromal glutamine synthetase in tumors disrupts tumor microenvironment-regulated cancer cell growth. Cell Metab 2016;24:685-700.
82. Zhao HY, Yang LF, Baddour J, et al. Tumor microenvironment derived exosomes pleiotropically modulate cancer cell metabolism. Elife 2016;5:e10250.
83. Zhang DX, Wang YB, Shi ZM, et al. Metabolic reprogramming of cancer-associated fibroblasts by IDH3α downregulation. Cell Rep 2015;10:1335-48.
84. Pavlides S, Whitaker-Menezes D, Castello-Cros R, et al. The reverse Warburg effect: aerobic glycolysis in cancer associated fibroblasts and the tumor stroma. Cell Cycle 2009;8:3984-4001.
85. Sotgia F, Martinez-Outschoorn UE, Howell A, Pestell RG, Pavlides S, Lisanti MP. Caveolin-1 and cancer metabolism in the tumor microenvironment: markers, models, and mechanisms. Annu Rev Pathol 2012;7:423-67.
86. Sousa CM, Biancur DE, Wang X, et al. Pancreatic stellate cells support tumour metabolism through autophagic alanine secretion. Nature 2016;536:479-83.
87. Wang WM, Kryczek I, Dostál L, et al. Effector T cells abrogate stroma-mediated chemoresistance in ovarian cancer. Cell 2016;165:1092-105.
88. Munn DH, Shafizadeh E, Attwood JT, Bondarev I, Pashine A, Mellor AL. Inhibition of T cell proliferation by macrophage tryptophan catabolism. J Exp Med 1999;189:1363-72.
89. Munn DH, Sharma MD, Baban B, et al. GCN2 kinase in T cells mediates proliferative arrest and anergy induction in response to indoleamine 2,3-dioxygenase. Immunity 2005;22:633-42.
90. Platten M, Wick W, Van den Eynde BJ. Tryptophan catabolism in cancer: beyond IDO and tryptophan depletion. Cancer Res 2012;72:5435-40.
91. Fletcher M, Ramirez ME, Sierra RA, et al. l-Arginine depletion blunts antitumor T-cell responses by inducing myeloid-derived suppressor cells. Cancer Res 2015;75:275-83.
92. Al-Sarireh B, Eremin O. Tumour-associated macrophages (TAMS): disordered function, immune suppression and progressive tumour growth. J R Coll Surg Edinb 2000;45:1-16.
93. Deng L, Zhou JF, Sellers RS, et al. A novel mouse model of inflammatory bowel disease links mammalian target of rapamycin-dependent hyperproliferation of colonic epithelium to inflammation-associated tumorigenesis. Am J Pathol 2010;176:952-67.
94. Sica A, Saccani A, Mantovani A. Tumor-associated macrophages: a molecular perspective. Int Immunopharmacol 2002;2:1045-54.
95. Heller DS, Hameed M, Cracchiolo B, et al. Presence and quantification of macrophages in squamous cell carcinoma of the cervix. Int J Gynecol Cancer 2003;13:67-70.
96. Murray PJ, Allen JE, Biswas SK, et al. Macrophage activation and polarization: nomenclature and experimental guidelines. Immunity 2014;41:14-20.
97. Langston PK, Shibata M, Horng T. Metabolism supports macrophage activation. Front Immunol 2017;8:61.
98. Rodríguez-Prados JC, Través PG, Cuenca J, et al. Substrate fate in activated macrophages: a comparison between innate, classic, and alternative activation. J Immunol 2010;185:605-14.
99. Jha AK, Huang SCC, Sergushichev A, et al. Network integration of parallel metabolic and transcriptional data reveals metabolic modules that regulate macrophage polarization. Immunity 2015;42:419-30.
100. Van den Bossche J, O’Neill LA, Menon D. Macrophage immunometabolism: where are we (going)? Trends Immunol 2017;38:395-406.
101. Haschemi A, Kosma P, Gille L, et al. The sedoheptulose kinase CARKL directs macrophage polarization through control of glucose metabolism. Cell Metab 2012;15:813-26.
102. Fuchs AL, Schiller SM, Keegan WJ, et al. Quantitative 1H NMR metabolomics reveal distinct metabolic adaptations in human macrophages following differential activation. Metabolites 2019;9:248.
103. O’Neill LA, Kishton RJ, Rathmell J. A guide to immunometabolism for immunologists. Nat Rev Immunol 2016;16:553-65.
104. Covarrubias AJ, Aksoylar HI, Horng T. Control of macrophage metabolism and activation by mTOR and Akt signaling. Semin Immunol 2015;27:286-96.
105. Festuccia WT, Pouliot P, Bakan I, Sabatini DM, Laplante M. Myeloid-specific Rictor deletion induces M1 macrophage polarization and potentiates in vivo pro-inflammatory response to lipopolysaccharide. PLoS One 2014;9:e95432.
106. de-Brito NM, Duncan-Moretti JC, da-Costa H, et al. Aerobic glycolysis is a metabolic requirement to maintain the M2-like polarization of tumor-associated macrophages. Biochim Biophys Acta Mol Cell Res 2020;1867:118604.
107. Arts RJW, Plantinga TS, Tuit S, et al. Transcriptional and metabolic reprogramming induce an inflammatory phenotype in non-medullary thyroid carcinoma-induced macrophages. Oncoimmunology 2016;5:e1229725.
108. Liu D, Chang C, Lu N, et al. Comprehensive proteomics analysis reveals metabolic reprogramming of tumor-associated macrophages stimulated by the tumor microenvironment. J Proteome Res 2017;16:288-97.
109. Poczobutt JM, De S, Yadav VK, et al. Expression profiling of macrophages reveals multiple populations with distinct biological roles in an immunocompetent orthotopic model of lung cancer. J Immunol 2016;196:2847-59.
110. Mestas J, Hughes CCW. Of mice and not men: differences between mouse and human immunology. J Immunol 2004;172:2731-8.
111. Ley K, Hoffman HM, Kubes P, et al. Neutrophils: new insights and open questions. Vol 3.; 2018. Available from: http://immunology.sciencemag.org/. [Last accessed on 24 Dec 2020].
112. Mantovani A, Cassatella MA, Costantini C, Jaillon S. Neutrophils in the activation and regulation of innate and adaptive immunity. Nat Rev Immunol 2011;11:519-31.
113. Kolaczkowska E, Kubes P. Neutrophil recruitment and function in health and inflammation. Nat Rev Immunol 2013;13:159-75.
114. Howard R, Kanetsky PA, Egan KM. Exploring the prognostic value of the neutrophil-to-lymphocyte ratio in cancer. Sci Rep 2019;9:19673.
115. Masucci MT, Minopoli M, Carriero MV. Tumor associated neutrophils. Their role in tumorigenesis, metastasis, prognosis and therapy. Front Oncol 2019;9:1146.
116. Fridlender ZG, Albelda SM. Tumor-associated neutrophils: friend or foe? Carcinogenesis 2012;33:949-55.
117. Sun R, Luo J, Li D, et al. Neutrophils with protumor potential could efficiently suppress tumor growth after cytokine priming and in presence of normal NK cells. Oncotarget 2014;5:12621-34.
118. Meyer PALGM. THE ACTION OF LETJCOCYTES ON GLUCOSE. J Biol Chem 1912;11:361-70. Available from: https://www.jbc.org/content/11/4/361.short. [Last accessed on 24 Dec 2020].
119. Maianski NA, Geissler J, Srinivasula SM, Alnemri ES, Roos D, Kuijpers TW. Functional characterization of mitochondria in neutrophils: a role restricted to apoptosis. Cell Death Differ 2004;11:143-53.
120. Maratou E, Dimitriadis G, Kollias A, et al. Glucose transporter expression on the plasma membrane of resting and activated white blood cells. Eur J Clin Invest 2007;37:282-90.
121. Zanoni I, Di Gioia M, Broggi A, Spreafico R, Kumar S, Dikshit M. Metabolic insight of neutrophils in health and disease. Front Immunol 2019;10:2099.
122. Simpson IA, Dwyer D, Malide D, et al. The facilitative glucose transporter GLUT3: 20 years of distinction. Am J Physiol Endocrinol Metab 2008;295:E242-53.
123. Loftus RM, Finlay DK. Immunometabolism: cellular metabolism turns immune regulator. J Biol Chem 2016;291:1-10.
124. Borregaard N, Herlin T. Energy metabolism of human neutrophils during phagocytosis. J Clin Invest 1982;70:550-7.
125. van Raam BJ, Sluiter W, de Wit E, Roos D, Verhoeven AJ, Kuijpers TW. Mitochondrial membrane potential in human neutrophils is maintained by complex III activity in the absence of supercomplex organisation. PLoS One 2008;3:e2013.
126. Chokesuwattanaskul S, Phelan MM, Edwards SW, Wright HL. A robust intracellular metabolite extraction protocol for human neutrophil metabolic profiling. PLoS One 2018;13:e0209270.
127. Ching-Cheng Huang S, Everts B, Ivanova Y, et al. Cell-intrinsic lysosomal lipolysis is essential for alternative activation of macrophages. Nat Immunol 2014;15:846-55.
128. Rice CM, Davies LC, Subleski JJ, et al. Tumour-elicited neutrophils engage mitochondrial metabolism to circumvent nutrient limitations and maintain immune suppression. Nat Commun 2018;9:5099.
129. Veglia F, Tyurin VA, Blasi M, et al. Fatty acid transport protein 2 reprograms neutrophils in cancer. Nature 2019;569:73-8.
130. Hsu BE, Tabariès S, Johnson RM, et al. Immature low-density neutrophils exhibit metabolic flexibility that facilitates breast cancer liver metastasis. Cell Rep 2019;27:3902-15.
131. Jing C, Castro-Dopico T, Richoz N, et al. Macrophage metabolic reprogramming presents a therapeutic target in lupus nephritis. Proc Natl Acad Sci U S A 2020;117:15160-71.
132. Don AS, Zheng XF. Recent clinical trials of mTOR-targeted cancer therapies. Rev Recent Clin Trials 2011;6:24-35.
133. Halbrook CJ, Pontious C, Kovalenko I, et al. Macrophage-released pyrimidines inhibit gemcitabine therapy in pancreatic cancer. Cell Metab 2019;29:1390-9.
134. Ouimet M, Ediriweera HN, Gundra UM, et al. MicroRNA-33-dependent regulation of macrophage metabolism directs immune cell polarization in atherosclerosis. J Clin Invest 2015;125:4334-48.
135. Wenes M, Shang M, Di Matteo M, et al. Macrophage metabolism controls tumor blood vessel morphogenesis and metastasis. Cell Metab 2016;24:701-15.
136. Simões RL, De-Brito NM, Cunha-Costa H, et al. Lipoxin A4 selectively programs the profile of M2 tumor-associated macrophages which favour control of tumor progression. Int J Cancer 2017;140:346-57.
137. de-Brito NM, da-Costa HC, Simões RL, Barja-Fidalgo C. Lipoxin-induced phenotypic changes in CD115+LY6Chi monocytes TAM precursors inhibits tumor development. Front Oncol 2019;9:540.
138. Erika Palmieri AM, Menga A, Martín-Pérez R, Guarini A, Mazzone M. Pharmacologic or genetic targeting of glutamine synthetase skews macrophages toward an M1-like phenotype and inhibits tumor metastasis. Cell Rep 2017;20:1654-66.
139. Weiss JM, Davies LC, Karwan M, et al. Itaconic acid mediates crosstalk between macrophage metabolism and peritoneal tumors. J Clin Invest 2018;128:3794-805.
140. Ligibel JA, Alfano CM, Courneya KS, et al. American Society of Clinical Oncology position statement on obesity and cancer. J Clin Oncol 2014;32:3568-74.
141. Lauby-Secretan B, Scoccianti C, Loomis D, Grosse Y, Bianchini F, Straif K; International Agency for Research on Cancer Handbook Working Group. Body fatness and cancer--viewpoint of the IARC working group. N Engl J Med 2016;375:794-8.
142. Quail DF, Dannenberg AJ. The obese adipose tissue microenvironment in cancer development and progression. Nat Rev Endocrinol 2019;15:139-54.
143. Moore T, Beltran L, Carbajal S, et al. Dietary energy balance modulates signaling through the Akt/mammalian target of rapamycin pathways in multiple epithelial tissues. Cancer Prev Res (Phila) 2008;1:65-76.
144. Jiang WQ, Zhu ZJ, Thompson HJ. Dietary energy restriction modulates the activity of AMP-activated protein kinase, Akt, and mammalian target of rapamycin in mammary carcinomas, mammary gland, and liver. Cancer Res 2008;68:5492-9.
145. Iyengar NM, Brown KA, Zhou XK, et al. Metabolic obesity, adipose inflammation and elevated breast aromatase in women with normal body mass index. Cancer Prev Res (Phila) 2017;10:235-43.
146. Carter JM, Hoskin TL, Pena MA, et al. Macrophagic “Crown-like Structures” are associated with an increased risk of breast cancer in benign breast disease. Cancer Prev Res (Phila) 2018;11:113-9.
147. Koru-Sengul T, Santander AM, Miao F, et al. Breast cancers from black women exhibit higher numbers of immunosuppressive macrophages with proliferative activity and of crown-like structures associated with lower survival compared to non-black Latinas and Caucasians. Breast Cancer Res Treat 2016;158:113-26.
148. Gucalp A, Iyengar NM, Zhou XK, et al. Periprostatic adipose inflammation is associated with high-grade prostate cancer. Prostate Cancer Prostatic Dis 2017;20:418-23.
149. Franklin RA, Liao W, Sarkar A, et al. The cellular and molecular origin of tumor-associated macrophages. Science 2014;344:921-5.
150. Edmunds LR, Sharma L, Kang A, et al. c-Myc programs fatty acid metabolism and dictates acetyl-CoA abundance and fate. J Biol Chem 2014;289:25382-92.
151. Lyssiotis CA, Son J, Cantley LC, Kimmelman AC. Pancreatic cancers rely on a novel glutamine metabolism pathway to maintain redox balance. Cell Cycle 2013;12:1987-8.
152. Son J, Lyssiotis CA, Ying HQ, et al. Glutamine supports pancreatic cancer growth through a KRAS-regulated metabolic pathway. Nature 2013;496:101-5.
153. Meyer KA, Neeley CK, Baker NA, et al. Adipocytes promote pancreatic cancer cell proliferation via glutamine transfer. Biochem Biophys Rep 2016;7:144-9.
154. Incio J, Liu H, Suboj P, et al. Obesity-induced inflammation and desmoplasia promote pancreatic cancer progression and resistance to chemotherapy. Cancer Discov 2016;6:852-69.
155. Rizi BS, Caneba C, Nowicka A, et al. Nitric oxide mediates metabolic coupling of omentum-derived adipose stroma to ovarian and endometrial cancer cells. Cancer Res 2015;75:456-71.
156. Nieman KM, Kenny HA, Penicka CV, et al. Adipocytes promote ovarian cancer metastasis and provide energy for rapid tumor growth. Nat Med 2011;17:1498-503.
157. Balaban S, Shearer RF, Lee LS, et al. Adipocyte lipolysis links obesity to breast cancer growth: adipocyte-derived fatty acids drive breast cancer cell proliferation and migration. Cancer Metab 2017;5:1.
158. Loo TM, Kamachi F, Watanabe Y, et al. Gut microbiota promotes obesity-associated liver cancer through PGE2-mediated suppression of antitumor immunity. Cancer Discov 2017;7:522-38.
159. Piotto M, Moussallieh F, Imperiale A, et al. Reproducible sample preparation and spectrum acquisition techniques for metabolic profiling of human tissues by proton high-resolution magic angle spinning nuclear magnetic resonance. In: Lutz N, Sweedler J, Wevers R, editors. Methodologies for metabolomics. Cambridge: Cambridge University Press; 2012. pp. 496-524.
160. Chan EC, Koh PK, Mal M, et al. Metabolic profiling of human colorectal cancer using high-resolution magic angle spinning nuclear magnetic resonance (HR-MAS NMR) spectroscopy and gas chromatography mass spectrometry (GC/MS). J Proteome Res 2009;8:352-61.
161. Mirnezami R, Jiménez B, Li JV, et al. Rapid diagnosis and staging of colorectal cancer via high-resolution magic angle spinning nuclear magnetic resonance (HR-MAS NMR) spectroscopy of intact tissue biopsies. Ann Surg 2014;259:1138-49.
162. Sitter B, Lundgren S, Bathen TF, Halgunset J, Fjosne HE, Gribbestad IS. Comparison of HR MAS MR spectroscopic profiles of breast cancer tissue with clinical parameters. NMR Biomed 2006;19:30-40.
163. Li ML, Song Y, Cho N, et al. An HR-MAS MR metabolomics study on breast tissues obtained with core needle biopsy. PLoS One 2011;6:e25563.
164. Tripathi P, Somashekar BS, Ponnusamy M, et al. HR-MAS NMR tissue metabolomic signatures cross-validated by mass spectrometry distinguish bladder cancer from benign disease. J Proteome Res 2013;12:3519-28.
165. Righi V, Cavallini N, Valentini A, et al. A metabolomic data fusion approach to support gliomas grading. NMR Biomed 2020;33:e4234.
166. Wishart DS. Emerging applications of metabolomics in drug discovery and precision medicine. Nat Rev Drug Discov 2016;15:473-84.
167. Beger RD, Dunn W, Schmidt MA, et al; for “Precision Medicine and Pharmacometabolomics Task Group”-Metabolomics Society Initiative. Metabolomics enables precision medicine: “A White Paper, Community Perspective”. Metabolomics 2016;12:149.
168. Yu L, Li KF, Zhang XY. Next-generation metabolomics in lung cancer diagnosis, treatment and precision medicine: mini review. Oncotarget 2017;8:115774-86.
Cite This Article
Export citation file: BibTeX | RIS
OAE Style
dos Santos GC, Saldanha-Gama R, de Brito NM, Renovato-Martins M, Barja-Fidalgo C. Metabolomics in cancer and cancer-associated inflammatory cells. J Cancer Metastasis Treat 2021;7:1. http://dx.doi.org/10.20517/2394-4722.2020.86
AMA Style
dos Santos GC, Saldanha-Gama R, de Brito NM, Renovato-Martins M, Barja-Fidalgo C. Metabolomics in cancer and cancer-associated inflammatory cells. Journal of Cancer Metastasis and Treatment. 2021; 7: 1. http://dx.doi.org/10.20517/2394-4722.2020.86
Chicago/Turabian Style
dos Santos, Gilson Costa, Roberta Saldanha-Gama, Natália Mesquita de Brito, Mariana Renovato-Martins, Christina Barja-Fidalgo. 2021. "Metabolomics in cancer and cancer-associated inflammatory cells" Journal of Cancer Metastasis and Treatment. 7: 1. http://dx.doi.org/10.20517/2394-4722.2020.86
ACS Style
dos Santos, GC.; Saldanha-Gama R.; de Brito NM.; Renovato-Martins M.; Barja-Fidalgo C. Metabolomics in cancer and cancer-associated inflammatory cells. J. Cancer. Metastasis. Treat. 2021, 7, 1. http://dx.doi.org/10.20517/2394-4722.2020.86
About This Article
Copyright

Data & Comments
Data


 Cite This Article 29 clicks

 Like This Article 31
likes
Like This Article 31
likes


Comments
Comments must be written in English. Spam, offensive content, impersonation, and private information will not be permitted. If any comment is reported and identified as inappropriate content by OAE staff, the comment will be removed without notice. If you have any queries or need any help, please contact us at support@oaepublish.com.