
Review of pharmacological inhibition of thyroid cancer metabolism

Abstract
Thyroid cancer (TC) is the most common malignancy of the endocrine system and has been rapidly increasing in incidence over the past few decades. Aggressive TCs metastasize quickly and often levy poor prognoses, as they are frequently resistant to first-line treatment options. Patients diagnosed with aggressive, dedifferentiated TC have a prognosis of under a year with the most current treatment modalities. Like many cancers, TCs also exhibit altered cell metabolism, which enhances the cell’s ability to generate energy, protect against reactive oxygen species, and synthesize macromolecules such as lipids, proteins, and nucleotides for proliferation. Genetic and enzyme profiling of TC tissues and cell lines have uncovered several dysregulated metabolic pathways such as glycolysis, the pentose phosphate pathway, glutamine metabolism, and pyrimidine synthesis. These aberrations are most often due to overexpression of rate-limiting enzymes or metabolite transporters. Metabolic pathways pose attractive therapeutic targets in aggressive TC and may serve to work in tandem with standard therapeutics such as kinase inhibitors depending on the genetic, metabolic, and signaling backgrounds of individual tumors. Further studies are needed to clearly delineate altered metabolic targets across TC subtypes for implementing therapeutic metabolic inhibitors that have shown success in other aggressive tumors.
Keywords
INTRODUCTION
Thyroid cancer (TC) is the most common endocrine malignancy and is a concern due to the rapidly increasing incidence[1]. There are specific subtypes of TC that differ in appearance, genetic drivers, prognosis, and effective treatment options. Papillary thyroid cancer (PTC) is the most common subtype and is often diagnosed in people under 55 years of age[2]. PTC still resembles a normal thyrocyte and is well differentiated. Resection is currently the most effective treatment option with radioactive iodine (RAI) therapy serving as an ablation for remaining TC tissue[3]. PTC is canonically driven by consistently active BRAF via a V600E mutation[1]. Follicular thyroid cancer (FTC) is usually more aggressive than PTC and is often diagnosed in patients between 40 and 60 years old[4]. It is most often treated with surgery and typically carries a good prognosis. However, drug resistance and distant metastases can develop. FTC is unique amongst the TC subtypes as BRAF mutations are rare[5]. FTC is canonically driven by phosphoinositide 3-kinase (PI3K) signaling, usually through activating mutations in PI3K and copy number gains in receptor tyrosine kinases and Akt[1,6]. Poorly differentiated (PDTC) and anaplastic thyroid cancers (ATC) are highly aggressive and metastatic. PDTC and ATC are driven by BRAFV600E, PI3K signaling, TERT promoter mutations, and mutated or loss of p53 expression[7-9]. The average lifespan for individuals diagnosed with PDTC/ATC is six months, amongst the shortest timeframe of all solid tumors[4,10]. Current therapies only extend survival to eleven months at best[3,10,11]; therefore, there is a clear and significant need for new treatment modalities in aggressive TCs for which current treatment regimens fail to significantly enhance disease-free survival.
Metabolic inhibitors pose as attractive potential options to address this need, as they have garnered significant treatment success in other tumor types, most notable antifolates in leukemias[12]. Cancer cells display a markedly different metabolic landscape, which parallels the altered signaling landscape these cells typically exhibit[13]. It is now known that many cancer cells demonstrate high glycolytic profiles with dysregulated oxidative phosphorylation and mitochondrial dynamics[14]. The increased rate of glycolysis not only supplies rapid ATP for the cell but also provides metabolic intermediates for protecting against reactive oxygen species and synthesizing nucleotides, lipids, and proteins for new daughter cells[13,14]. Although multiple metabolic processes have been shown to be dysregulated in TC, there has not been great attention on targeting these pathways for therapeutic intervention, particularly in cases of aggressive and often drug-resistant ATC. This review serves to summarize results in metabolism across the spectrum of TC differentiation while highlighting key areas that deserve further investigation that could potentially yield promising therapeutic efficacy.
GLYCOLYSIS
Glucose transporters
Glucose transporters (GLUT) are the first rate-limiting step in glycolysis [Figure 1] and often regulate cellular metabolism in general by limiting intracellular glucose flux[15]. There are 14 distinct isoforms of GLUTs which vary based on tissue localization and affinity for glucose[15]. Normal thyroid cells express GLUT 1, 3, 4, and 10[16-19]. GLUT 4 and 10 have not been found to be overexpressed in TC, but GLUT 1 and 3 are overexpressed in multiple forms of TC[16,17,19]. GLUT1 expression is inversely correlated with TC differentiation, as ATC has been shown to have the highest GLUT1 expression[16,17]. Furthermore, there appears to be a strong correlation between BRAFV600E and GLUT1 expression, possibly suggesting that TC cells driven by MAPK signaling require a high flux of glucose to fuel proliferation[19,20]. GLUT3 is expressed even more than GLUT1 in some PTC tumors and was overexpressed in well differentiated TC cell lines[21].
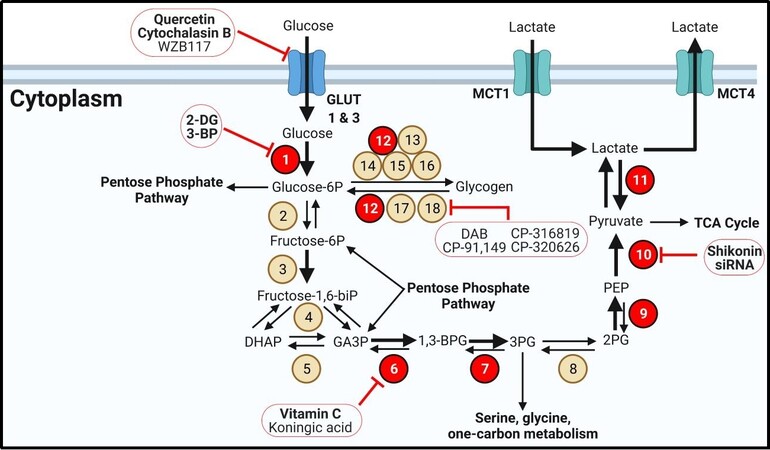
Figure 1. Glycolysis and glycogen metabolism. Glycolytic enzymes and transporters are dysregulated in many forms of thyroid cancer. Bold text for transporters indicates overexpression. Bold arrows indicate increased metabolite flux. Beige circles indicate enzymes not shown to be aberrantly expressed in TC. Red circles display overexpressed enzymes in TC. Inhibitors are outlined in red circles with conjoining red inhibitor (T) bars. Inhibitors in bold have demonstrated efficacy in TC models. Enzyme/transporter key: 1. Hekoxinase; 2. Glucose-6-phosphate isomerase; 3. Phosphofructokinase-1; 4. Aldolase A; 5. Triose phosphate isomerase; 6. Glyceraldehyde-3-phosphate dehydrogenase; 7. Phosphoglycerate kinase 1; 8. Phosphoglycerate mutase; 9. Enolase; 10. Pyruvate kinase; 11. Lactate dehydrogenase, 12. Phosphoglucomutase-1; 13. UDP-glucose pyrophosphorylase 2; 14. Glycogenin; 15. Glycogen synthase 1; 16. Glycogen branching enzyme; 17. Glycogen debranching enzyme; 18. Glycogen phosphorylase. MCT: Monocarboxylate transporter.
There have been several GLUT inhibitors investigated for limiting glucose import in cancer cells. Although not specific for GLUTs, the flavonol quercetin directly binds to GLUT1 and can limit GLUT4 localization to the plasma membrane via inhibiting PI3K[22-24]. Quercetin induced apoptosis in PTC cells in vitro[25]. Cytochalasin B, a mycotoxin that binds in the central cavity of GLUT1, significantly limited glucose uptake in PTC cells[26]. Recently, more selective and potent GLUT inhibitors have been developed such as Glutor. Glutor is highly potent and selective for GLUT 1 and 3 and has demonstrated success at inhibiting growth in vitro with nearly 100 cancer cell lines but not TC cells[27].
Once glucose has entered the cell, it is irreversibly phosphorylated by hexokinases (HK) to generate glucose-6-phosphate (G6P), preventing it from being exported[15]. High HK expression is correlated with BRAFV600E status as well as poor survival in PTC patients[28]. Furthermore, PDTC and ATC almost always have the highest HK expression in TC[18,28]. The most well-studied HK inhibitor is 2-deoxyglucose (2-DG), a glucose analog that is unable to be phosphorylated. 2-DG limited PTC, FTC, and ATC growth in vitro and reduced tumor size in an ATC xenograft[29-31]. 3-bromopyruvate is a similar inhibitor of HK that reduced PDTC growth in vitro but is not currently in any clinical trials[32]. Although HK is an attractive target as the first rate-limiting step in glycolysis, unwanted toxicity may prove to be a difficult challenge to manage clinically. Additionally, glycolysis is crucial for the activation of T cells, dendritic cells, natural killer cells, and B cells to initiate an immune response[33,34]. Targeting specific metabolic pathways that are uniquely dysregulated in an individual tumor may limit unwanted deleterious effects on the immune system.
JOURNEY TO PYRUVATE
Following glucose phosphorylation and isomerization via glucose phosphate isomerase, phosphofructosekinase-1 generates fructose-1,6-bisphosphate (fructose-1,6-biP)[15,35]. Two molecules of glyceraldehyde-3-phosphate (GA3P) are generated from fructose-1,6-biP via aldolase A and triose phosphate isomerase[15,35]. Glyceraldehyde 3-phosphate dehydrogenase (GAPDH) converts GA3P to 1,3-bisphosphoglycerate (1,3-BPG) and forms ATP in the process. GAPDH is overexpressed in PTC and FTC and is a promising drug target[31]. Kumagai et al.[36] reported that koningic acid, a GAPDH inhibitor, inhibited proliferation of leukemia cells in addition to murine breast, Ehrlich ascites, and fibrosarcoma cells in vitro as well as Ehrlich ascites in vivo. Interestingly, vitamin C has been found to inhibit PTC, FTC, and ATC growth in vitro; Su et al.[37] reported that pharmaceutical grade injections of vitamin C slowed ATC tumor growth by inducing reactive oxygen species and inhibiting MAPK and PI3K signaling via GAPDH inhibition.
1,3 BPG then generates ATP and 3-phosphoglycerate (3PG) by phosphoglycerate kinase (PGK1) which was highly expressed in a PTC model (B-CPAP cells) as well as PTC tissue[38,39]. Following isomerization via phosphoglycerate mutase, enolase generates phosphoenolpyruvate (PEP)[15,35]. Enolase 1 (ENO1) is expressed ubiquitously while enolase 2 (ENO2) is typically found in neurons and has been recommended as a tumor marker for its high expression in some cancers[40]. ENO1 is overexpressed in the B-CPAP cell line while ENO2 was highly expressed in B-CPAP and FTC-133 cells[31,39]. Since cancer cells rely so heavily on glycolysis for ATP and the metabolic intermediate pyruvate, these reactions in glycolysis provide promising targets for pharmacological intervention in TC.
Pyruvate kinase
The final rate-limiting step of glycolysis is pyruvate kinase (PKM1)[15,35]. While PKM1 is expressed in most tissues and serves only to phosphorylate PEP, PKM2 is frequently overexpressed in cancers and acts as a strict checkpoint to regulate the metabolic demands of cancer cells[41,42]. PKM2 is often found as a tetramer, in which it forms pyruvate from PEP. Unlike PKM1, PKM2 is allosterically regulated by fructose-1,6-biP to enhance enzymatic activity on PEP to increase the rate of glycolysis in cancer cells[42-44]. A key difference between isozymes is that the PKM2 tetramer is stabilized by the presence of serine and succinyl-5-aminoimidazole-4-carboxamide-1-ribose 5-phosphate (SAICAR), important intermediates of one carbon metabolism and purine synthesis[45]. When nucleotide levels are high, the cell is able to employ these two metabolites to encourage glycolysis for ATP and NADH production. When serine and SAICAR levels are low, PKM2 adopts its dimer form which has a dramatically reduced affinity for PEP. As a dimer, PKM2 moonlights as a protein kinase for over one hundred substrates such as EGFR, HER2, FGFR, cell-cycle proteins, and notable to TC, ERK[46]. ERK is not only phosphorylated by PKM2 but it phosphorylates PEP in a positive feedback loop to encourage adopting the PKM2 dimer form. As a dimer, glycolysis bottlenecks as PEP levels rise, favoring the reverse reactions via partial gluconeogenesis to 2PG and 3PG. 3PG is then anabolized to serine via three reactions which will favor the tetrameric form of PKM2, continuing glycolysis[15,35]. PKM2 represents a critical junction in cancer metabolism by simultaneously regulating glycolysis and nucleotide metabolism while phosphorylating several tumor promoters. There is only one PKM1/2 inhibitor available, shikonin. Shikonin inhibits multiple cell processes in addition to PKM2 but was effective at slowing FTC growth in vivo[47,48]. Additionally, siRNA against PKM2 demonstrates robust activity at inhibiting PTC growth in vitro and in vivo[49].
FATE OF PYRUVATE IN THE CYTOPLASM
Pyruvate can be funneled into the tricarboxylic acid (TCA) cycle for further ATP generation or may be converted to lactate to replenish glycolytic intermediates[15]. In highly glycolytic tumors such as aggressive, dedifferentiated TC, pyruvate is frequently converted to lactate by lactate dehydrogenase (LDH)[39,50]. This reaction is significant for regenerating NAD+ from NADH[15]. The NAD+ can then serve as a cofactor for GAPDH in glycolysis, further generating ATP. LDH is a tetramer frequently composed of LDHA and LDHB subunits. LDHA is typically expressed in the liver and skeletal muscle while LDHB is found in the kidneys and heart muscle[15]. Importantly, LDHA preferentially converts pyruvate to lactate, generating NAD+, while LDHB performs the opposite reaction[15]. The predominantly expressed isotype may shed light onto the preferential route of metabolism in cancer cells. There are seemingly conflicting reports on LDH expression and function in TC. Mirebeau-Prunier et al.[51] found that FTC cells and tissue samples exhibit high LDHB/LDHA ratios based on mRNA levels of each isoform. Kachel et al.[52] reported that LDHA protein is mildly overexpressed in FTC and PTC but not ATC compared to non-tumor tissues, while only ATC demonstrated significantly higher transcript levels of LDHA. Similarly, Coelho et al.[53] discovered that PTC cell lines showed no differences in LDHA transcript levels compared to normal thyroid cells. Paradoxically, both sets of PTC cells demonstrated higher lactate production rates[53]. Taken together, these three studies may reflect a lack of correlation between LDH transcript expression with protein expression and that post translational modifications are highly important for LDH activity. Indeed, Kachel et al.[52] showed that FGFR1 mediated phosphorylation and activity of LDHA, and p-LDHA was markedly elevated in PTC, FTC, and ATC tumors. Cells that maintain a high LDHA/LDHB isozyme ratio may favor converting pyruvate to lactate to continue glycolysis. Excess lactate can then be exported to the stroma via monocarboxylate transporter 4 (MCT4) to prevent reconversion to pyruvate and acidify the tumor microenvironment (TME)[54]. Inhibiting lactate production and export could help balance the pH of the TME to protect infiltrating immune cells. Indeed, limiting TME lactate levels protects naïve T cells from apoptosis[33]. A cancer cell that maintains a high LDHB/LDHA ratio, however, may rely on lactate produced by cancer associated fibroblasts (CAFs) that is imported via MCT1[54,55]. The lactate is then converted to pyruvate and NADH. This phenomenon has been coined the “reverse Warburg effect”, in which cancer cells are able to exploit the high energy lactate from CAFs for anabolism without requiring ATP investment to oxidize glucose[56]. There is strong evidence supporting MCT expression in TC. Patient derived samples revealed that PTC, FTC, and ATC all express MCT4 for lactate export, with ATC having the highest expression of all types of TC[28]. However, MCT1 was only found expressed at an appreciable level in samples from ATC patients[55]. This is unsurprising, as all types of TC expressed a method for exporting lactate from highly glycolytic cells. The MCT1/4 expression pattern may reveal an avenue of metabolic plasticity in ATC, in which these highly dedifferentiated, aggressive tumors are able to shuttle lactate in and out of the cell depending on the precise metabolic demand that is met by pyruvate dehydrogenation.
GLYCOGEN METABOLISM
In a well-fed state, cells may store excess glucose in the form of glycogen, which is normally found in high quantities in the liver, muscle, and brain[15]. However, many cancers have been found to metabolize glycogen outside of these tissue types[57-60]. To date, there have been no direct reports of glycogen in TC, yet glycogen can be detected in bovine and canine thyroids[61]. Furthermore, there are rare cases of clear cell thyroid carcinomas, aggressive tumors filled with solid deposits that may contain glycogen[62]. Phosphoglucose mutase (PGM1) appears to be one of the few reported enzymes that is overexpressed in the pathway, as shown in PTC and FTC cells[31]. Although not a rate-limiting enzyme, PGM1 represents an important step in glycogen metabolism that acts in both anabolism and catabolism[63]. PGM1 converts G6P to glucose-1-phosphate (G1P) and then to uridine diphosphate glucose via UDP-glucose pyrophosphorylase 2 for incorporation into glycogen. Glycogen synthase 1 forms 1-4 α glycosidic linkages with UDP-glucose onto an already formed glycogen granule initiated by the self-glycosylating primer, glycogenin. Glycogen branching enzyme (GBE) forms 1-6 α linkages to create branches of G1P monomers[15,35]. In a starved state, the cell relies on glycogen phosphorylase (PYG) to cleave 1-4 α glycosidic bonds to liberate G1P monomers from the ends of glycogen chains. Glycogen debranching enzyme assists in this process by removing G1P 1-6 α glycosidic bonds formed by GBE[64].
There are several inhibitors designed to target the rate-limiting enzyme of glycogen breakdown, PYG. 1,4-dideoxy-1,4-amino-D-arabinitol (DAB) is a potent PYG inhibitor and the only one that directly inhibits the PYG active site[65,66]. DAB prevented hypoxia-induced cell survival in colorectal and breast cancer cells following glucose deprivation[63]. The remaining PYG inhibitors discussed here bind to the allosteric “indole” pocket of PYG, named for the indole structure these inhibitors contain[58,60]. CP-91,149 was designed to treat diabetes and was able to significantly decrease blood glucose levels in obese mice without inducing hypoglycemia in lean mice[67]. CP-91,149 is a pan PYG inhibitor that reduced cell viability in models of hepatocellular, prostate, and lung carcinoma[68-70]. Excitingly, CP-91,149 was highly synergistic with the BRAF inhibitor sorafenib in hepatocellular carcinoma, which is the standard therapy for ATC[69]. Additionally, CP-316819 enhanced melatonin cytotoxicity in Ewing sarcoma cells, and CP-320626 induced apoptosis in pancreatic carcinoma cells[71,72]. Although PYG inhibitors have demonstrated robust success in vitro, these promising results have yet to be validated for in vivo tumor models, let alone in any TC model. Therefore, glycogen metabolism represents an exciting but unexplored avenue of therapeutic intervention in TC.
THE PENTOSE PHOSPHATE PATHWAY
In addition to supplying energy and reducing equivalents in the form of ATP and NADH, glycolysis is used to generate the building blocks for nucleotide synthesis and protecting against reactive oxygen species (ROS) via the pentose phosphate pathway (PPP) [Figure 2][73,74]. G6P can be diverted to the PPP via glucose 6 phosphate dehydrogenase (G6PDH). This enzyme forms 6-gluconophospholactone and regenerates NADPH from NADP+. NADPH is used in fatty acid synthesis and reduces redox enzymes[15,35,73,74]. G6PDH is the rate-limiting step in the PPP and represents an attractive target in cancer cell metabolism, particularly in TC which has been shown to overexpress the enzyme in PTC, FTC, and ATC cells[31,75]. 6-aminonicatinomide (6-AN) is a selective, competitive inhibitor of G6PDH that demonstrated success in inducing apoptosis in PTC and ATC models[75]. Following conversion to 6PG via 6-phosphogluconolactonase, 6-phosphogluconate dehydrogenase (6PGDH) forms another equivalent of NADPH as well as the intermediate ribulose-5-phosphate (RL5P)[73]. 6PGDH was found to be significantly expressed in PTC fine-needle aspirations as well as cell culture models of ATC following doxorubicin treatment, possibly representing an evolutionary drug resistance mechanism[76,77]. This resistance was overcome by inhibiting 6PGDH with physcion, which re-sensitized ATC cells to doxorubicin[76]. RL5P is converted to an epimer via ribulose-5-phosphate 3-epimerase (forming xylulose-5-phosphate, X5P) or isomer using ribose-5-phosphate isomerase (forming ribose-5-phosphate, R5P) depending on the balance of products and metabolic requirements in the cell[15,35,73,74]. R5P serves as the building block for forming nucleotides. One equivalent of R5P and two equivalents of X5P are required to regenerate the glycolytic intermediates GA3P and F6P. These interconversions are performed by transketolase and transaldolase[35,73,74]. Transketolase is overexpressed in PTC and ATC cells, and inhibition by oxythiamine suppressed PTC and ATC growth and exhibited drug additivity with 6-AN[75]. The PPP is a crucial metabolic pathway in cancer cells for forming nucleotides, a requirement for DNA synthesis and cell division, and combating excessive levels of ROS. Inhibitors of this pathway have demonstrated impressive success in ATC cell culture models, warranting further investigations in vivo.
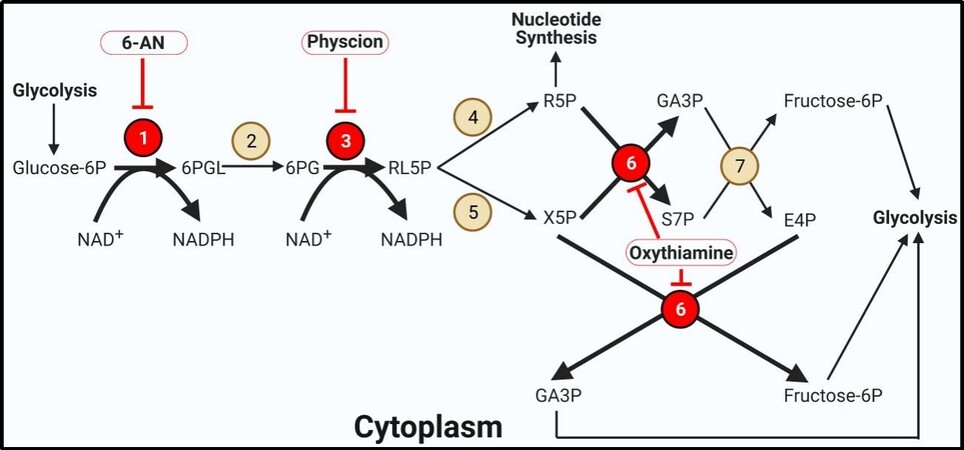
Figure 2. The pentose phosphate pathway. The pentose phosphate pathway is highly active in thyroid cancer. Bold arrows indicate increased metabolite flux. Beige circles indicate enzymes not shown to be aberrantly expressed in TC. Red circles display overexpressed enzymes in TC. Inhibitors are outlined in red circles with conjoining red inhibitor (T) bars. Inhibitors in bold have demonstrated efficacy in TC models. Enzyme key: 1. Glucose-6-phosphate dehydrogenase; 2. 6-Phosphogluconolactonase; 3. 6-Phosphogluconate dehydrogenase; 4. Ribose-5-phosphate isomerase; 5. Ribulose-5-phosphate 3-epimerase; 6. Transketolase; 7. Transaldolase.
FATE OF PYRUVATE IN THE MITOCHONDRIA
In a highly glycolytic cancer cell, pyruvate is most frequently converted to lactate[78-80]. However, pyruvate can also generate acetyl-CoA for use in the TCA cycle. High pyruvate levels favor transport into the mitochondria via mitochondrial pyruvate carrier 1 and 2[81]. High concentrations of NAD+, PEP, and pyruvate encourage the dehydrogenation to acetyl-CoA via pyruvate dehydrogenase (PDH)[15,35]. Along with acetyl-CoA, PDH forms another molecule of NADH from NAD+. The acetyl-CoA is then able to progress in the TCA cycle[15,35]. In reality, this reaction does not occur at an appreciable rate in cancer cells due to the rare instance of the cell having a high NAD+/NADH ratio[82]. Instead, mitochondrial pyruvate is more likely to be irreversibly converted to oxaloacetic acetate (OAA) via pyruvate carboxylase, which requires ATP and bicarbonate[83]. OAA may be used to refuel the TCA cycle if mutations in isocitrate dehydrogenase or succinate dehydrogenase cause a broken TCA cycle [Figure 3][83]. In some cancers, the mitochondrial isoform of PEP carboxykinase (PEPCK) converts OAA to PEP for transport to the cytoplasm via the mitochondrial citrate carrier (CIC)[84]. This is the only method for a cell to convert pyruvate back to PEP for gluconeogenesis[15,35].
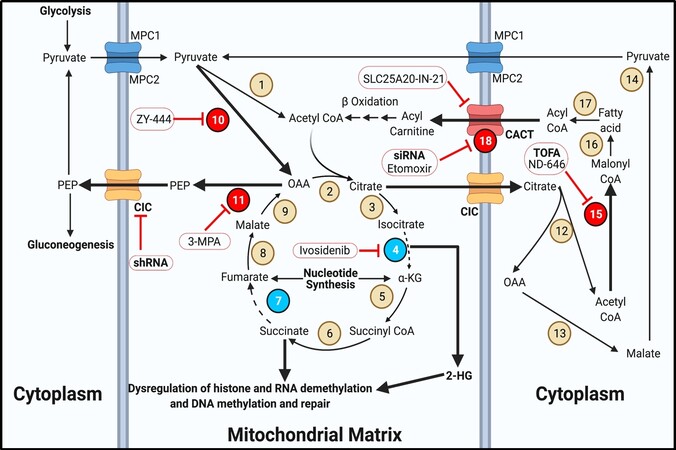
Figure 3. TCA cycle and fatty acid metabolism. The TCA cycle and fatty acid metabolism serve to replenish intermediates for metabolic pathways in thyroid cancer. Bold text for transporters indicates overexpression. Bold arrows indicate increased metabolite flux. Beige circles indicate enzymes not shown to be aberrantly expressed in TC. Red bubbles display overexpressed enzymes in TC. Cyan bubbles indicate mutated or underexpressed enzymes in TC. Inhibitors are outlined in red circles with conjoining red inhibitor (T) bars. Inhibitors in bold have demonstrated efficacy in TC models. Enzyme/transporter key: 1. Pyruvate dehydrogenase; 2. Citrate synthase; 3. Aconitase; 4. Isocitrate dehydrogenase; 5. Alpha ketoglutarate dehydrogenase; 6. Succinyl-CoA synthetase; 7. Succinate dehydrogenase; 8. Fumarase; 9. Malate dehydrogenase 2; 10. Pyruvate carboxylase; 11. Phosphoenolpyruvate carboxykinase 2; 12. ATP-citrate lyase; 13. Malate dehydrogenase 1; 14. Malic enzyme; 15. Acetyl-CoA carboxylase; 16. Fatty acid synthase; 17. Acyl-CoA synthetase; 18. Carnitine palmitoyltransferase 1. CIC: Mitochondrial citrate carrier; CACT: carnitine acylcarnitine translocase; MPC: mitochondrial pyruvate carrier.
Interestingly, Vincent et al.[84] reported that out of several types of solid tumors they investigated, PTC samples had the highest expression of PEPCK, and 3-Mercaptopropionic acid inhibited PEPCK in lung cancer cells. Despite this observation, PEPCK inhibition remains an unexplored target in TC. Finally, CIC is overexpressed in PTC and ATC, at least in part through dysregulation in a lncRNA-miRNA axis[85]. ShRNA targeted against CIC resulted in reduced PTC and ATC cell migration in vitro[85].
THE TCA CYCLE
In cancer cells, the TCA cycle serves as a hub for anaplerosis and fatty acid metabolism, often being co-opted by overexpression or mutations of key enzymes to fuel cancer progression. Citrate is formed from OAA and acetyl-CoA via citrate synthase. Citrate can be converted to isocitrate via aconitase and then to alpha ketoglutarate (αKG) via isocitrate dehydrogenase (IDH)[15,35]. However, isozymes of IDH are frequently mutated in several cancers, causing the first stall in the TCA cycle[86-88]. IDH mutations form the oncometabolite 2-hydroxyglutarate (2-HG) at higher rates than wildtype IDH, which competitively inhibits several nuclear proteins such as histone and RNA demethylases and DNA methylation and repair enzymes[86,88]. 2-HG is likely best studied in glioblastoma, in which high levels of 2-HG have been shown to induce vascularization via epigenetic reprogramming[87]. There have been numerous reports of IDH1 mutations in TC patients representing at least seven unique amino acid substitutions across PTC, FTC, and ATC subgroups[89,90]. Regardless of these specific IDH1 mutations promote the 2-HG formation, high levels of wildtype IDH increased 2-HG levels in PTC[91]. Continuing in the cycle, αKG forms succinyl-CoA by alpha ketoglutarate dehydrogenase and then succinate by succinyl-CoA synthetase[15,35]. Succinate is normally converted to fumarate via succinate dehydrogenase (SDH), then to malate via fumarase, and finally back to OAA by malate dehydrogenase 2[15,35]. SDH, a bona fide tumor suppressor, is frequently mutated or underexpressed in cancers[92,93]. There are reports of several single nucleotide polymorphisms in SDHB and SDHD in PTC and FTC patients[94,95]. Additionally, tumors with wildtype SDHx exhibited lower expression of SDHB and SDHD compared to matched normal tissue, suggesting a mutually exclusive mechanism for succinate buildup[93,94]. This second break in the TCA cycle can cause an increase in succinate levels which acts in a similar fashion to 2-HG in the nucleus[93]. Although SDH function cannot be restored in TC patients, IDH inhibitors are effective treatment options in other cancers. The pan IDH inhibitor ivosidenib significantly reduced tumor burden in patients with IDH mutations and is approved for use in AML[96]. IDH inhibitors may be useful in treating TC tumors harboring IDH mutations or elevated 2-HG levels.
FATTY ACID METABOLISM
Fatty acids have long been accepted to play an oncogenic role in cancer. They represent a rich carbon source that can be synthesized de novo or taken up from the bloodstream to contribute to hormone synthesis, membrane expansion, energy storage, and cell signaling[97-99]. In ATC, fatty acid synthesis is crucial for maintaining endoplasmic reticulum homeostasis and the unfolded protein response[100,101]. Fatty acids are first synthesized from citrate produced in the TCA cycle. Citrate is exported to the cytoplasm via CIC where it is split into acetyl-CoA and OAA via malate dehydrogenase 1. The liberated malate is converted to pyruvate via malic enzyme[15,35]. Excess acetyl-CoA in the cytoplasm is converted to malonyl CoA via the rate-limiting enzyme, acetyl-CoA carboxylase (ACC), which is overexpressed in PTC, FTC, and ATC[102]. Although not tested in TC, ND-646 can specifically inhibit ACC[103]. The ACC inhibitor TOFA [5-(tetradecyloxy)-2-furoic acid], inhibited PTC, FTC, and ATC growth in vitro, which was reversible with the addition of palmitic acid[102]. Several rounds of fatty acid synthase will form long chain fatty acids in the cytoplasm. When the cell reaches a low energy state, fatty acids are catabolized to acyl CoA via acyl-CoA synthetase. Acyl-CoA is converted to acyl-carnitine via carnitine palmitoyltransferase 1 (CPT1) for entry into the mitochondria via carnitine acylcarnitine translocase (CACT)[15,35]. CPT1 is overexpressed in several cancers, including PTC[104]. Although the classic CPT1 inhibitor etomoxir does not appear to have been tested in TC models, siRNA against CPT1 decreased PTC growth[104]. CACT can be overexpressed in FTC tumors harboring a PPAR-PAX8 fusion, but the specific CACT inhibitor, SLC25A20-IN-21, has not been investigated in cancer models[105,106]. Acyl-carnitine requires conversion back to acyl-CoA via CPT2 and several rounds of beta oxidation using multiple enzymes to liberate acetyl-CoA for use in the TCA cycle[15,35]. Fatty acid metabolism represents an exciting if underrepresented area in TC metabolism.
NUCLEOTIDE SYNTHESIS
Highly proliferative cancer cells require an abundance of nucleotides for replicating the genome. Although some of this high nucleotide requirement is met by diet and bloodstream uptake, the vast majority is synthesized de novo[73,107-111]. Nucleotide synthesis makes use of several metabolites from central metabolic pathways [Figure 4]. The PPP is required for the ribose base and NADPH as a reducing agent; glutamine and aspartate donate nitrogen, and glycine and serine donate specific carbon atoms for the nucleoside base[15,35]. Although specific purine metabolism enzymes do not appear to be overexpressed in TC, pyrimidine enzymes are shown to be aberrantly expressed in multiple models of TC.
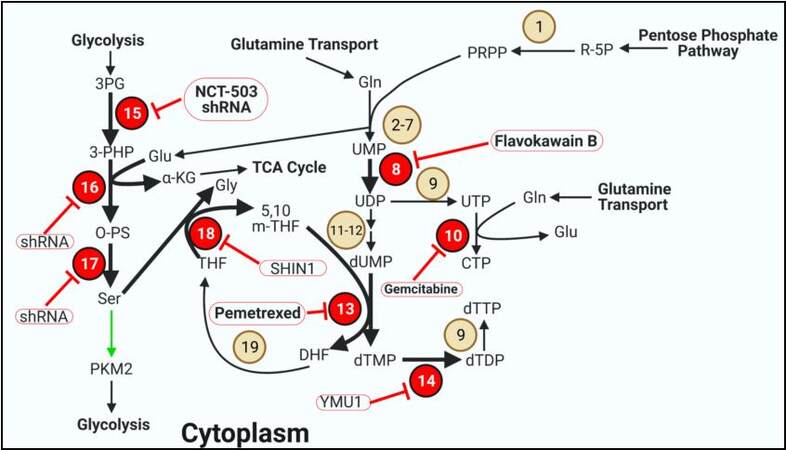
Figure 4. Pyrimidine synthesis and one carbon metabolism. Several enzymes involved in pyrimidine synthesis and one carbon metabolism are overexpressed in thyroid cancer. Bold arrows indicate increased metabolite flux. Beige circles indicate enzymes not shown to be aberrantly expressed in TC. Red circles display overexpressed enzymes in TC. Inhibitors are outlined in red circles with conjoining red inhibitor (T) bars. Inhibitors in bold have demonstrated efficacy in TC models. Green arrows indicate allosteric regulation of the indicated enzyme. Enzyme/transporter/metabolite key: 1. PRPP synthetase; 2. Carbamoyl-phosphate synthetase 2; 3. Aspartate transcarbamoylase; 4. Dihydroorotase; 5. Dihydroorotate dehydrogenase; 6. Orotate phosphoribosyltransferase; 7. Orotidine-5′-phosphate decarboxylase; 8. Uridine-cytidine kinase 2; 9. Nucleoside diphosphate kinase A; 10. CTP synthetase; 11. Ribonucleotide reductase; 12. dUTP diphosphatase; 13. Thymidylate synthase; 14. Deoxythymidylate kinase; 15. Phosphoglycerate dehydrogenase; 16. Phosphoserine aminotransferase 1; 17. Phosphoserine phosphatase; 18. Serine hydroxymethyltransferase 1; 19. Dihydrofolate reductase. PKM2: Pyruvate kinase 2.
Pyrimidine synthesis
Pyrimidine synthesis begins with R5P following conversion to phosphoribosylpyrophosphate (PRPP). Five additional steps requiring glutamine transform PRPP to UMP[15,35]. UMP is phosphorylated to UDP via uridine-cytidine kinase 2 (UCK2), which is overexpressed in PTC (TCGA)[112]. Flavokawain B from the kava plant has activity against UCK2 and was effective against FTC in vivo[113]. UDP can be phosphorylated to UTP and converted to CTP using glutamine and CTP synthetase (CTPS), which is overexpressed in PTC (TCGA)[112]. CTPS can be inhibited using the nucleoside analog gemcitabine which is incorporated into replicating DNA strands[114]. Gemcitabine is currently in a phase II clinical trial for differentiated and metastatic PTC and FTC[115], while in vitro efficacy has been demonstrated in ATC[116]. Inhibiting CTPS is an attractive target because in addition to preventing CTP synthesis, UTP is necessary for glycogen synthesis, and excess UTP has potential for incorporation into DNA, forming mismatches with GTP[35,117-119]. UDP can also be reduced and phosphorylated in sequence to form dUMP, which is converted to dTMP by thymidylate synthase (TYMS)[15,35]. TYMS is overexpressed in a variety of cancers including PTC and FTC[112,120]. TYMS is an attractive metabolic target and one of the earliest targets in cancer using antifolates[121]. Now there are several TYMS inhibitors such as pemetrexed, which also has activity against dihydrofolate reductase (DHFR). Pemetrexed was well tolerated in a Phase Ib safety evaluation in advanced/metastatic TC and is in a phase II clinical trial in combination with paclitaxel for aggressive TC[122,123]. dTDP is phosphorylated to dTTP via deoxythymidylate kinase (DTYMK), which is also overexpressed in PTC[112]. YMU1 is a specific inhibitor of DTYMK that was effective at sensitizing breast, colorectal, and bone cancer cells to doxorubicin while reducing colon cancer growth in vivo[119].
ONE CARBON METABOLISM
Several of the steps outline in nucleotide metabolism build upon the nitrogenous and ribonucleotide bases a few atoms at a time. These carbons are provided by glycine and folate derivates which are generated from serine[15,35,107-110]. Highly active serine synthesis is a hallmark of cancer metabolism and represents attractive targets for therapy, particularly in TC in which all three enzymes are overexpressed in PTC and ATC[124]. 3PG generated in glycolysis is converted to 3-PHP by phosphoglycerate dehydrogenase (PGDH)[15,35]. Both NCT-503 and shRNA demonstrated robust success in inhibiting PGDH to reduce PTC and ATC cell viability[125]. 3-PHP is converted to O-PS by phosphoserine aminotransferase 1 (PSAT1), generating αKG from OAA in the process. O-PS is dephosphorylated to serine via phosphoserine phosphatase (PSPH)[15,35]. While there are currently no specific inhibitors for PSAT1 or PSPH, shRNA against each enzyme were effective at inhibiting breast and lung cancer respectively[126,127]. Serine is converted to glycine in the cytoplasm via serine hydroxymethyltransferase 1 (SHMT1) to donate a methylene group to tetrahydrofolate (THF), forming 5,10 m-THF in the process[35]. SHMT1 is high in PTC and ATC and can be inhibited with SHIN1, which has a high affinity for both isoforms of SHMT[124,128]. The 5,10 m-THF is then used for dTMP generation via TYMS, forming dihydrofolate (DHF) in the process. DHF is converted back to THF via DHFR, which requires NADPH to be re-oxidized[15,35].
GLUTAMINE METABOLISM
Glutamine is recognized as one of the most important amino acids in cancer metabolism[129]. It acts as a carbon and nitrogen source for a variety of important biosynthetic pathways. Glutamine is the most abundant amino acid in serum and is taken up by the cell by a few transporters, most notably alanine, serine, cysteine transporter 2 (ASCT2) [Figure 5][130]. ASCT2 expression is correlated with BRAFV600E and is expressed the highest in PDTC tumors[131]. Small molecules such as L-γ-Glutamyl-p-nitroanilide, phenylacetate, and V-9302 are selective inhibitors for blocking ASCT2-mediated glutamine transport[132-135]. Notably, phenylacetate inhibited PTC and FTC growth in vitro[136]. Once in the cell, glutamine can immediately be used in several steps of nucleotide synthesis to donate nitrogen atoms to the ribose base[35,111,129]. In the cytoplasm, glutamine can be exchanged for neutral non-branched amino acids via LAT1 which was highly expressed in PTC and ATC[137]. JPH203, a LAT1 inhibitor, slowed TC growth in vitro and inhibited ATC growth in xenograft models[137,138]. Glutamine can also be converted to glutamate by glutaminase (GLS1/2), which is highly expressed in PTC, FTC, and ATC[131,139]. Glutaminase inhibitors such as CB-839 and BPTES have already demonstrated success at inhibiting PTC and ATC growth in vitro[140,141]. Glutamate and aspartate can be transaminated to αKG and OAA via aspartate aminotransferase. These anaplerotic reactions are essential for replenishing TCA cycle intermediates from excess glutamate and aspartate[15,35]. Glutamate can directly be converted to αKG in the mitochondria via glutamate dehydrogenase (GDH), which is overexpressed in PTC, FTC, and ATC[131]. GDH is inhibited by epigallocatechin gallate, which worked well in PTC and FTC to slow growth[142].
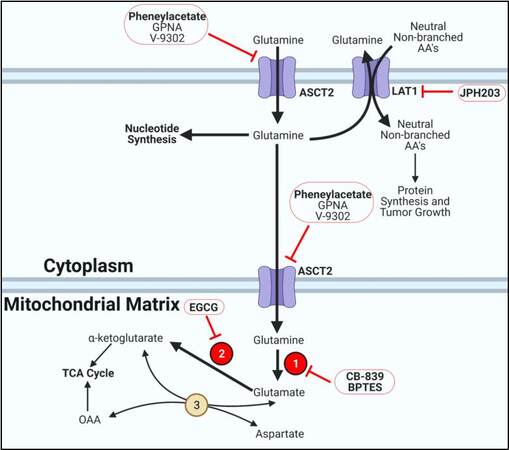
Figure 5. Glutamine metabolism. Thyroid cancer cells overexpress glutamine transporters and enzymes to fuel tumor progression. Bold arrows indicate increased metabolite flux. Beige circles indicate enzymes not shown to be aberrantly expressed in TC. Red circles display overexpressed enzymes in TC. Inhibitors are outlined in red circles with conjoining red inhibitor (T) bars. Inhibitors in bold have demonstrated efficacy in TC models. Enzyme key: 1. Glutaminase; 2. Glutamate dehydrogenase; 3. Aspartate aminotransferase.
THYROID CANCER METABOLISM AND CELL SIGNALING INTEGRATION
It is important to understand the metabolic landscape of an individual tumor to strategically inhibit aberrant metabolic pathways [Figure 6]. PTC and ATC tumors typically exhibit overactive MAPK signaling due to BRAFV600E[1]. Hyperphosphorylation of the downstream targets of BRAF, MEK and ERK, leads to increased cell proliferation, survival, and inhibition of apoptosis by regulating oncogene transcription[143]. Constitutively activated BRAF strongly correlates with enhanced expression of all three serine synthesis genes[124]. Whether this observation is simply a correlation, or if these genes are directly regulated by MAPK signaling is unknown. At least in PTC, PKM2 is highly expressed, which increases the rate of glycolysis, and PKM2 is further activated by high serine levels[45,46,49]. Low serine levels cause PKM2 to adopt a dimer configuration to support serine and nucleotide synthesis. This is further promoted by ERK-mediated phosphorylation, and p-PKM2 can phosphorylate ERK in return to enhance oncogenic signaling[42,44,46]. This serine-PKM2-ERK axis may represent an unexplored metabolic switch in TC tumors driven by BRAFV600E. In contrast to PTC, FTC (and ATC) tumors demonstrate highly active PI3K signaling. The tumor promoters Akt and mTORC1 are phosphorylated as a result of aberrant PI3K activity and have major roles in macromolecule synthesis. Akt stimulates fatty acid and glycogen synthesis while mTORC1 promotes protein synthesis by regulating translation factors and inhibits autophagy[1,6,144-146]. Accordingly, FTC tumors have been shown to upregulate fatty acid metabolism via ACC and CACT[102,105], the glycogen buildup and breakdown enzyme PGM1[31], and enzymes for amino acid metabolism such as ASCT2, GLS, and GDH[131,139]. There may be a connection between the aberrant signaling landscape in FTC tumors and these specific metabolic pathways. FTC tumors may be primed to store carbon in the form of glycogen and fatty acid via Akt. Metformin, a pan-metabolic inhibitor, activates AMPK to inhibit mTOR1 and decrease blood glucose and insulin levels. Metformin was effective at inhibiting PTC, FTC, and ATC growth in vitro and is currently in a phase II clinical trial in combination with RAI for differentiated TC[31,147-149].
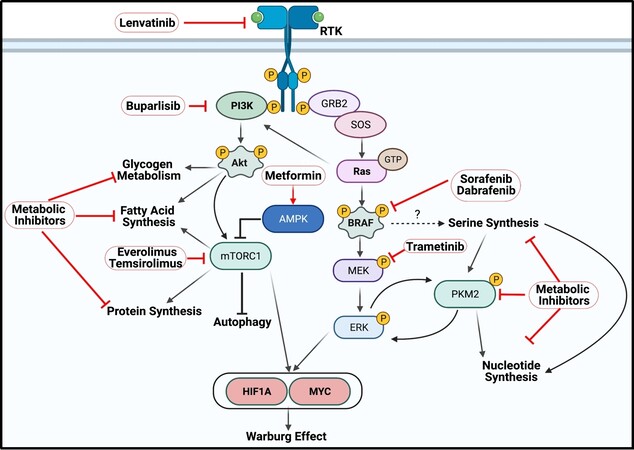
Figure 6. Thyroid cancer oncogenesis frequently invokes activation of PI3K-Akt-mTOR signaling in FTC and ATC and MAPK signaling in PTC and ATC. PI3K signaling is often induced by PI3K activating mutations and copy number variations in Akt and RTKs. The PI3K pathway induces changes in cell metabolism by regulating glycogen storage via Akt, protein synthesis and autophagy via mTORC1, and fatty acid metabolism from Akt and mTORC1, which is regulated by AMPK. BRAF is often constitutively activated in PTC and ATC tumors via the V600E gain-of-function mutation which is correlated with high expression of enzymes in serine synthesis. Downstream of BRAF is ERK, which phosphorylates pyruvate kinase 2 (PKM2) to promote nucleotide synthesis and ERK phosphorylation. Aggressive TCs such as ATC often harbor Ras mutations that activate both sets of pathways. PI3K and MAPK signaling increases expression and stability of the transcription factors hypoxia-inducible factor 1 alpha (HIF1A) and MYC, which in turn increase expression of enzymes in glycolysis, PPP, and amino acid metabolism to promote the Warburg effect. Kinase inhibitors marked in bold have demonstrated varying levels of success in aggressive TC, but drug resistance and tumor recurrence often develop, suggesting the need for combined therapies.
MAPK signaling converges with PI3K signaling to regulate the expression and function of MYC and HIF1A. Akt and mTORC1 upregulate MYC expression via enhancing translation[150-152], and Akt signaling also inhibits phosphorylation of MYC at thr58, preventing degradation[150,153]. MAPK signaling phosphorylates MYC at ser62, extending the half-life[150,153]. PI3K and MAPK signaling both enhance HIF1A expression through increased translation. MYC and HIF1A are considered the Warburg effect gatekeepers, as both MYC and HIF1A are frequently overexpressed in TC and increase the expression of several rate-limiting enzymes in glycolysis such as GLUTs, HK, PGK1, LDH, and MCTs as well as G6PDH and GLS[18,50,151,152,154,155]. Unsurprisingly, nearly all of these genes are increased in PTC, FTC, and ATC, which represent important steps for carbon flux through glycolysis and the PPP and nitrogen acquisition from glutamine. This complex interplay between cell signaling and metabolism in cancer cells may be exploited for strategic drug combinations that work against both oncogenic processes in aggressive TC.
CONCLUSION
Cancer cells must extensively reprogram metabolism for successful tumorigenesis. Rerouted metabolism is essential for generating energy in the form of ATP, quenching ROS in the form of NADPH, generating nucleotides de novo, forming adequate amino acid levels for protein and DNA synthesis, and storing carbon in the form of fatty acids and glycogen. These pathways in cancer cell metabolism are attractive targets for chemotherapeutic intervention. Although metabolic inhibitors have demonstrated robust success in vitro, high toxicity could be seen in vivo if not strategically administered. Metabolic inhibitors would likely be most efficacious when administered to patients with mutations or amplifications in specific metabolic enzymes, as opposed to targeting a ubiquitous enzyme such as hexokinase[156].
Numerous metabolic inhibitors in many types of cancers have received admirable success and are advancing in clinical trials. These metabolic inhibitors are even more successful when paired with specific kinase inhibitors or broad-spectrum chemotherapies in certain tumors. Sorafenib and lenvatinib are the first-line therapies for aggressive ATC[3,10]. However, these kinase inhibitors as well as the MEK inhibitor trametinib have disappointing long-term efficacy[157]. The most effective current treatment modalities extend the patient lifespan to only eleven months in ATC, yet the strategic combination of metabolic and kinase inhibitors has not been attempted in vivo[158,159]. For example, combining lower doses of kinase inhibitors with nucleotide synthesis inhibitors in aggressive, BRAF-driven TC tumors may prove to be an effective synergistic drug strategy that also limits toxicity. Likewise, kinase inhibitors targeted against PI3K and mTOR such as buparlisib, everolimus, and temsirolimus have demonstrated only modest success in advanced TC[160-164]. Patients exhibited reduced tumor burden initially, but drug resistance and relapse inevitably occurred. As the field in TC metabolism advances, we will need a more thorough delineation of enzyme expression patterns and metabolite levels to formulate the most specific and effective targeted strategies for improving clinical outcomes.
DECLARATIONS
AcknowledgmentsWe thank Dr. Eyal Amiel (Department of Biomedical and Health Sciences, University of Vermont) for lending his expertise in metabolism for thoughtful contributions to editing. All figures were generated using BioRender.com. Figures 1 and 6 were adapted from premade templates: Glycolysis and Glycolytic Enzymes and PI3K/Akt, RAS/MAPK, JAK/STAT Signaling.
Authors’ contributionsDrafted the manuscript and figures: Davidson CD
Provided assistance with planning, conceptualizing, and editing: Carr FE
Availability of data and materialsNot applicable.
Financial support and sponsorshipDavidson CD is supported in part by the University of Vermont Cancer Center.
Conflicts of interestBoth authors declared that there are no conflicts of interest.
Ethical approval and consent to participateNot applicable.
Consent for publicationNot applicable.
Copyright© The Author(s) 2021.
REFERENCES
2. Lim H, Devesa SS, Sosa JA, Check D, Kitahara CM. Trends in thyroid cancer incidence and mortality in the United States, 1974-2013. JAMA 2017;317:1338-48.
3. Valerio L, Pieruzzi L, Giani C, et al. Targeted therapy in thyroid cancer: State of the art. Clin Oncol (R Coll Radiol) 2017;29:316-24.
5. Kebebew E, Weng J, Bauer J, et al. The prevalence and prognostic value of BRAF mutation in thyroid cancer. Ann Surg 2007;246:466-70; discussion 470.
6. Shinohara M, Chung YJ, Saji M, Ringel MD. AKT in thyroid tumorigenesis and progression. Endocrinology 2007;148:942-7.
7. Liu Z, Hou P, Ji M, et al. Highly prevalent genetic alterations in receptor tyrosine kinases and phosphatidylinositol 3-kinase/akt and mitogen-activated protein kinase pathways in anaplastic and follicular thyroid cancers. J Clin Endocrinol Metab 2008;93:3106-16.
8. Landa I, Ganly I, Chan TA, et al. Frequent somatic TERT promoter mutations in thyroid cancer: higher prevalence in advanced forms of the disease. J Clin Endocrinol Metab 2013;98:E1562-6.
9. Landa I, Ibrahimpasic T, Boucai L, et al. Genomic and transcriptomic hallmarks of poorly differentiated and anaplastic thyroid cancers. J Clin Invest 2016;126:1052-66.
10. Jayarangaiah A, Sidhu G, Brown J, et al. Therapeutic options for advanced thyroid cancer. Int J Clin Endocrinol Metab 2019;5:26-34.
11. Pereira M, Williams VL, Hallanger Johnson J, Valderrabano P. Thyroid cancer incidence trends in the United States: association with changes in professional guideline recommendations. Thyroid 2020;30:1132-40.
12. Zarou MM, Vazquez A, Vignir Helgason G. Folate metabolism: a re-emerging therapeutic target in haematological cancers. Leukemia 2021;35:1539-51.
13. Ferreira LM, Hebrant A, Dumont JE. Metabolic reprogramming of the tumor. Oncogene 2012;31:3999-4011.
15. Nelson DL, Lehninger AL, Cox MM. . Lehninger principles of biochemistry. London: Macmillan; 2008.
16. Haber RS, Weiser KR, Pritsker A, Reder I, Burstein DE. GLUT1 glucose transporter expression in benign and malignant thyroid nodules. Thyroid 1997;7:363-7.
17. Jóźwiak P, Krześlak A, Bryś M, Lipińska A. Glucose-dependent glucose transporter 1 expression and its impact on viability of thyroid cancer cells. Oncol Rep 2015;33:913-20.
18. Coelho RG, Fortunato RS, Carvalho DP. Metabolic reprogramming in thyroid carcinoma. Front Oncol 2018;8:82.
19. Heydarzadeh S, Moshtaghie AA, Daneshpoor M, Hedayati M. Regulators of glucose uptake in thyroid cancer cell lines. Cell Commun Signal 2020;18:83.
20. Suh HY, Choi H, Paeng JC, Cheon GJ, Chung JK, Kang KW. Comprehensive gene expression analysis for exploring the association between glucose metabolism and differentiation of thyroid cancer. BMC Cancer 2019;19:1260.
21. Ciampi R, Vivaldi A, Romei C, et al. Expression analysis of facilitative glucose transporters (GLUTs) in human thyroid carcinoma cell lines and primary tumors. Mol Cell Endocrinol 2008;291:57-62.
22. Nomura M, Takahashi T, Nagata N, et al. Inhibitory mechanisms of flavonoids on insulin-stimulated glucose uptake in MC3T3-G2/PA6 adipose cells. Biol Pharm Bull 2008;31:1403-9.
23. Maurya AK, Vinayak M. PI-103 and quercetin attenuate PI3K-AKT signaling pathway in T-cell lymphoma exposed to hydrogen peroxide. PLoS One 2016;11:e0160686.
24. Hamilton KE, Rekman JF, Gunnink LK, et al. Quercetin inhibits glucose transport by binding to an exofacial site on GLUT1. Biochimie 2018;151:107-14.
25. Mutlu Altundağ E, Kasacı T, Yılmaz AM, et al. Quercetin-induced cell death in human papillary thyroid cancer (B-CPAP) cells. J Thyroid Res 2016;2016:9843675.
26. Ruan M, Liu M, Dong Q, Chen L. Iodide- and glucose-handling gene expression regulated by sorafenib or cabozantinib in papillary thyroid cancer. J Clin Endocrinol Metab 2015;100:1771-9.
27. Reckzeh ES, Karageorgis G, Schwalfenberg M, et al. Inhibition of glucose transporters and glutaminase synergistically impairs tumor cell growth. Cell Chem Biol 2019;26:1214-1228.e25.
28. Nahm JH, Kim HM, Koo JS. Glycolysis-related protein expression in thyroid cancer. Tumour Biol 2017;39:1010428317695922.
29. Sandulache VC, Skinner HD, Wang Y, et al. Glycolytic inhibition alters anaplastic thyroid carcinoma tumor metabolism and improves response to conventional chemotherapy and radiation. Mol Cancer Ther 2012;11:1373-80.
30. Wang SY, Wei YH, Shieh DB, et al. 2-Deoxy-d-Glucose can complement doxorubicin and sorafenib to suppress the growth of papillary thyroid carcinoma cells. PLoS One 2015;10:e0130959.
31. Bikas A, Jensen K, Patel A, et al. Glucose-deprivation increases thyroid cancer cells sensitivity to metformin. Endocr Relat Cancer 2015;22:919-32.
32. Dima M, Miller KA, Antico-Arciuch VG, Di Cristofano A. Establishment and characterization of cell lines from a novel mouse model of poorly differentiated thyroid carcinoma: powerful tools for basic and preclinical research. Thyroid 2011;21:1001-7.
33. O'Sullivan D, Sanin DE, Pearce EJ, Pearce EL. Metabolic interventions in the immune response to cancer. Nat Rev Immunol 2019;19:324-35.
34. Patel CH, Leone RD, Horton MR, Powell JD. Targeting metabolism to regulate immune responses in autoimmunity and cancer. Nat Rev Drug Discov 2019;18:669-88.
35. . King, M. Integrative medical biochemistry: examination and board review. McGraw-Hill; 2014.
36. Kumagai S, Narasaki R, Hasumi K. Glucose-dependent active ATP depletion by koningic acid kills high-glycolytic cells. Biochem Biophys Res Commun 2008;365:362-8.
37. Su X, Shen Z, Yang Q, et al. Vitamin C kills thyroid cancer cells through ROS-dependent inhibition of MAPK/ERK and PI3K/AKT pathways via distinct mechanisms. Theranostics 2019;9:4461-73.
38. Chen M, Shen M, Li Y, et al. GC-MS-based metabolomic analysis of human papillary thyroid carcinoma tissue. Int J Mol Med 2015;36:1607-14.
39. Yu W, Yang Z, Huang R, Min Z, Ye M. SIRT6 promotes the Warburg effect of papillary thyroid cancer cell BCPAP through reactive oxygen species. Onco Targets Ther 2019;12:2861-8.
40. Vizin T, Kos J. Gamma-enolase: a well-known tumour marker, with a less-known role in cancer. Radiol Oncol 2015;49:217-26.
41. Mazurek S. Pyruvate kinase type M2: a key regulator of the metabolic budget system in tumor cells. Int J Biochem Cell Biol 2011;43:969-80.
42. Chen X, Chen S, Yu D. Protein kinase function of pyruvate kinase M2 and cancer. Cancer Cell Int 2020;20:523.
43. Zhang Z, Deng X, Liu Y, Liu Y, Sun L, Chen F. PKM2, function and expression and regulation. Cell Biosci 2019:9.
44. Yang J, Liu H, Liu X, Gu C, Luo R, Chen HF. Synergistic allosteric mechanism of fructose-1,6-bisphosphate and serine for pyruvate kinase M2 via dynamics fluctuation network analysis. J Chem Inf Model 2016;56:1184-92.
45. Chaneton B, Hillmann P, Zheng L, et al. Serine is a natural ligand and allosteric activator of pyruvate kinase M2. Nature 2012;491:458-62.
46. Keller KE, Doctor ZM, Dwyer ZW, Lee YS. SAICAR induces protein kinase activity of PKM2 that is necessary for sustained proliferative signaling of cancer cells. Mol Cell 2014;53:700-9.
47. Yang Q, Ji M, Guan H, Shi B, Hou P. Shikonin inhibits thyroid cancer cell growth and invasiveness through targeting major signaling pathways. J Clin Endocrinol Metab 2013;98:E1909-17.
48. Zhao X, Zhu Y, Hu J, et al. Shikonin inhibits tumor growth in mice by suppressing pyruvate kinase M2-mediated aerobic glycolysis. Sci Rep 2018;8:14517.
49. Feng C, Gao Y, Wang C, et al. Aberrant overexpression of pyruvate kinase M2 is associated with aggressive tumor features and the BRAF mutation in papillary thyroid cancer. J Clin Endocrinol Metab 2013;98:E1524-33.
50. Gao Y, Yang F, Yang XA, et al. Mitochondrial metabolism is inhibited by the HIF1α-MYC-PGC-1β axis in BRAF V600E thyroid cancer. FEBS J 2019;286:1420-36.
51. Mirebeau-Prunier D, Le Pennec S, Jacques C, et al. Estrogen-related receptor alpha modulates lactate dehydrogenase activity in thyroid tumors. PLoS One 2013;8:e58683.
52. Kachel P, Trojanowicz B, Sekulla C, Prenzel H, Dralle H, Hoang-Vu C. Phosphorylation of pyruvate kinase M2 and lactate dehydrogenase A by fibroblast growth factor receptor 1 in benign and malignant thyroid tissue. BMC Cancer 2015;15:140.
53. Coelho RG, Cazarin JM, Cavalcanti de Albuquerque JP, de Andrade BM, Carvalho DP. Differential glycolytic profile and Warburg effect in papillary thyroid carcinoma cell lines. Oncol Rep 2016;36:3673-81.
54. Gill KS, Tassone P, Hamilton J, et al. Thyroid cancer metabolism: a review. J Thyroid Disord Ther 2016;5:200.
55. Johnson JM, Lai SY, Cotzia P, et al. Mitochondrial metabolism as a treatment target in anaplastic thyroid cancer. Semin Oncol 2015;42:915-22.
56. Fu Y, Liu S, Yin S, et al. The reverse Warburg effect is likely to be an Achilles' heel of cancer that can be exploited for cancer therapy. Oncotarget 2017;8:57813-25.
57. Rousset M, Zweibaum A, Fogh J. Presence of glycogen and growth-related variations in 58 cultured human tumor cell lines of various tissue origins. Cancer Res 1981;41:1165-70.
58. Zois CE, Harris AL. Glycogen metabolism has a key role in the cancer microenvironment and provides new targets for cancer therapy. J Mol Med (Berl) 2016;94:137-54.
59. Shulman RG, Rothman DL. The glycogen shunt maintains glycolytic homeostasis and the warburg effect in cancer. Trends Cancer 2017;3:761-7.
62. Carcangiu ML, Sibley RK, Rosai J. Clear cell change in primary thyroid tumors. A study of 38 cases. Am J Surg Pathol 1985;9:705-22.
63. Pelletier J, Bellot G, Gounon P, Lacas-Gervais S, Pouysségur J, Mazure NM. Glycogen synthesis is induced in hypoxia by the hypoxia-inducible factor and promotes cancer cell survival. Front Oncol 2012;2:18.
64. Adeva-Andany MM, González-Lucán M, Donapetry-García C, Fernández-Fernández C, Ameneiros-Rodríguez E. Glycogen metabolism in humans. BBA Clin 2016;5:85-100.
65. Andersen B, Rassov A, Westergaard N, Lundgren K. Inhibition of glycogenolysis in primary rat hepatocytes by 1, 4-dideoxy-1,4-imino-D-arabinitol. Biochem J 1999;342 Pt 3:545-50.
66. Jakobsen P, Lundbeck JM, Kristiansen M, et al. Iminosugars: potential inhibitors of liver glycogen phosphorylase. Bioorganic & Medicinal Chemistry 2001;9:733-44.
67. Martin WH, Hoover DJ, Armento SJ, et al. Discovery of a human liver glycogen phosphorylase inhibitor that lowers blood glucose in vivo. Proc Natl Acad Sci U S A 1998;95:1776-81.
68. Schnier JB, Nishi K, Monks A, Gorin FA, Bradbury E. Inhibition of glycogen phosphorylase (GP) by CP-91,149 induces growth inhibition correlating with brain GP expression. Biochemical and Biophysical Research Communications 2003;309:126-34.
69. Barot S, Abo-Ali EM, Zhou DL, Palaguachi C, Dukhande VV. Inhibition of glycogen catabolism induces intrinsic apoptosis and augments multikinase inhibitors in hepatocellular carcinoma cells. Exp Cell Res 2019;381:288-300.
70. Schnier JB, Nishi K, Gumerlock PH, Gorin FA, Bradbury EM. Glycogen synthesis correlates with androgen-dependent growth arrest in prostate cancer. BMC Urol 2005;5:6.
71. Sanchez-Sanchez AM, Antolin I, Puente-Moncada N, et al. Melatonin cytotoxicity is associated to warburg effect inhibition in ewing sarcoma cells. PLoS One 2015;10:e0135420.
72. Lee WN, Guo P, Lim S, et al. Metabolic sensitivity of pancreatic tumour cell apoptosis to glycogen phosphorylase inhibitor treatment. Br J Cancer 2004;91:2094-100.
74. Jiang P, Du W, Wu M. Regulation of the pentose phosphate pathway in cancer. Protein Cell 2014;5:592-602.
75. Liu CL, Hsu YC, Lee JJ, et al. Targeting the pentose phosphate pathway increases reactive oxygen species and induces apoptosis in thyroid cancer cells. Mol Cell Endocrinol 2020;499:110595.
76. Ma L, Cheng Q. Inhibiting 6-phosphogluconate dehydrogenase reverses doxorubicin resistance in anaplastic thyroid cancer via inhibiting NADPH-dependent metabolic reprogramming. Biochem Biophys Res Commun 2018;498:912-7.
77. Giusti L, Iacconi P, Ciregia F, et al. Fine-needle aspiration of thyroid nodules: proteomic analysis to identify cancer biomarkers. J Proteome Res 2008;7:4079-88.
78. Potter M, Newport E, Morten KJ. The Warburg effect: 80 years on. Biochem Soc Trans 2016;44:1499-505.
79. Vaupel P, Schmidberger H, Mayer A. The Warburg effect: essential part of metabolic reprogramming and central contributor to cancer progression. Int J Radiat Biol 2019;95:912-9.
80. Mishra D, Banerjee D. Lactate dehydrogenases as metabolic links between tumor and stroma in the tumor microenvironment. Cancers (Basel) 2019;11:750.
81. Schell JC, Olson KA, Jiang L, et al. A role for the mitochondrial pyruvate carrier as a repressor of the Warburg effect and colon cancer cell growth. Mol Cell 2014;56:400-13.
82. Liberti MV, Locasale JW. The warburg effect: how does it benefit cancer cells? Trends Biochem Sci 2016;41:211-8.
83. Lao-On U, Attwood PV, Jitrapakdee S. Roles of pyruvate carboxylase in human diseases: from diabetes to cancers and infection. J Mol Med (Berl) 2018;96:237-47.
84. Vincent EE, Sergushichev A, Griss T, et al. Mitochondrial phosphoenolpyruvate carboxykinase regulates metabolic adaptation and enables glucose-independent tumor growth. Mol Cell 2015;60:195-207.
85. Liu S, Zhang D, Chen L, Gao S, Huang X. Long non-coding RNA BRM promotes proliferation and invasion of papillary thyroid carcinoma by regulating the microRNA-331-3p/SLC25A1 axis. Oncol Lett 2020;19:3071-8.
86. Losman JA, Kaelin WG Jr. What a difference a hydroxyl makes: mutant IDH, (R)-2-hydroxyglutarate, and cancer. Genes Dev 2013;27:836-52.
87. Reiter-Brennan C, Semmler L, Klein A. The effects of 2-hydroxyglutarate on the tumorigenesis of gliomas. Contemp Oncol (Pozn) 2018;22:215-22.
89. Murugan AK, Bojdani E, Xing M. Identification and functional characterization of isocitrate dehydrogenase 1 (IDH1) mutations in thyroid cancer. Biochem Biophys Res Commun 2010;393:555-9.
90. Hemerly JP, Bastos AU, Cerutti JM. Identification of several novel non-p.R132 IDH1 variants in thyroid carcinomas. Eur J Endocrinol 2010;163:747-55.
91. Rakheja D, Boriack RL, Mitui M, Khokhar S, Holt SA, Kapur P. Papillary thyroid carcinoma shows elevated levels of 2-hydroxyglutarate. Tumour Biol 2011;32:325-33.
92. Laurenti G, Tennant DA. Isocitrate dehydrogenase (IDH), succinate dehydrogenase (SDH), fumarate hydratase (FH): three players for one phenotype in cancer? Biochem Soc Trans 2016;44:1111-6.
93. Dalla Pozza E, Dando I, Pacchiana R, et al. Regulation of succinate dehydrogenase and role of succinate in cancer. Semin Cell Dev Biol 2020;98:4-14.
94. Ni Y, Seballos S, Ganapathi S, et al. Germline and somatic SDHx alterations in apparently sporadic differentiated thyroid cancer. Endocr Relat Cancer 2015;22:121-30.
97. Currie E, Schulze A, Zechner R, Walther TC, Farese RV Jr. Cellular fatty acid metabolism and cancer. Cell Metab 2013;18:153-61.
98. Carracedo A, Cantley LC, Pandolfi PP. Cancer metabolism: fatty acid oxidation in the limelight. Nat Rev Cancer 2013;13:227-32.
99. Li Z, Zhang H. Reprogramming of glucose, fatty acid and amino acid metabolism for cancer progression. Cell Mol Life Sci 2016;73:377-92.
100. von Roemeling CA, Marlow LA, Pinkerton AB, et al. Aberrant lipid metabolism in anaplastic thyroid carcinoma reveals stearoyl CoA desaturase 1 as a novel therapeutic target. J Clin Endocrinol Metab 2015;100:E697-709.
101. Roemeling CA, Copland JA. Targeting lipid metabolism for the treatment of anaplastic thyroid carcinoma. Expert Opin Ther Targets 2016;20:159-66.
102. Kim H, Butt M, Brose M. . Acetyl coa carboxylase: a potential therapeutic target in thyroid cancer. Cancer Res 2008;68:2370.
103. Li EQ, Zhao W, Zhang C, et al. Synthesis and anti-cancer activity of ND-646 and its derivatives as acetyl-CoA carboxylase 1 inhibitors. Eur J Pharm Sci 2019;137:105010.
104. Wang R, Cheng Y, Su D, et al. Cpt1c regulated by AMPK promotes papillary thyroid carcinomas cells survival under metabolic stress conditions. J Cancer 2017;8:3675-81.
105. Giordano TJ, Au AY, Kuick R, et al. Delineation, functional validation, and bioinformatic evaluation of gene expression in thyroid follicular carcinomas with the PAX8-PPARG translocation. Clin Cancer Res 2006;12:1983-93.
106. Parker CG, Kuttruff CA, Galmozzi A, et al. Chemical proteomics identifies SLC25A20 as a functional target of the ingenol class of actinic keratosis drugs. ACS Cent Sci 2017;3:1276-85.
107. Locasale JW. Serine, glycine and one-carbon units: cancer metabolism in full circle. Nat Rev Cancer 2013;13:572-83.
109. Maddocks OD, Labuschagne CF, Adams PD, Vousden KH. Serine metabolism supports the methionine cycle and DNA/RNA methylation through de novo ATP synthesis in cancer cells. Mol Cell 2016;61:210-21.
110. Newman AC, Maddocks ODK. Serine and functional metabolites in cancer. Trends Cell Biol 2017;27:645-57.
111. Shuvalov O, Petukhov A, Daks A, Fedorova O, Vasileva E, Barlev NA. One-carbon metabolism and nucleotide biosynthesis as attractive targets for anticancer therapy. Oncotarget 2017;8:23955-77.
112. Wang H, Wang X, Xu L, Zhang J, Cao H. High expression levels of pyrimidine metabolic rate-limiting enzymes are adverse prognostic factors in lung adenocarcinoma: a study based on The Cancer Genome Atlas and Gene Expression Omnibus datasets. Purinergic Signal 2020;16:347-66.
113. He Q, Liu W, Sha S, et al. Adenosine 5'-monophosphate-activated protein kinase-dependent mTOR pathway is involved in flavokawain B-induced autophagy in thyroid cancer cells. Cancer Sci 2018;109:2576-89.
114. Voigt W, Kegel T, Weiss M, Mueller T, Simon H, Schmoll HJ. Potential activity of paclitaxel, vinorelbine and gemcitabine in anaplastic thyroid carcinoma. J Cancer Res Clin Oncol 2005;131:585-90.
115. Spano JP, Vano Y, Vignot S, et al. GEMOX regimen in the treatment of metastatic differentiated refractory thyroid carcinoma. Med Oncol 2012;29:1421-8.
116. Celano M, Calvagno MG, Bulotta S, et al. Cytotoxic effects of gemcitabine-loaded liposomes in human anaplastic thyroid carcinoma cells. BMC Cancer 2004;4:63.
117. Shelton J, Lu X, Hollenbaugh JA, Cho JH, Amblard F, Schinazi RF. Metabolism, biochemical actions, and chemical synthesis of anticancer nucleosides, nucleotides, and base analogs. Chem Rev 2016;116:14379-455.
118. Amini SK. Relative populations of some tautomeric forms of 2'-deoxyguanosine-5-fluorouridine mismatch. J Phys Chem B 2018;122:4433-44.
119. Hu CM, Yeh MT, Tsao N, et al. Tumor cells require thymidylate kinase to prevent dUTP incorporation during DNA repair. Cancer Cell 2012;22:36-50.
120. Hossain MA, Asa TA, Rahman MM, et al. Network-based genetic profiling reveals cellular pathway differences between follicular thyroid carcinoma and follicular thyroid adenoma. Int J Environ Res Public Health 2020;17:1373.
121. Gangjee A, Jain HD. Antifolates -- past, present and future. Curr Med Chem Anticancer Agents 2004;4:405-10.
122. Hanauske AR, Lahn M, Musib LC, et al. Phase Ib safety and pharmacokinetic evaluation of daily and twice daily oral enzastaurin in combination with pemetrexed in advanced/metastatic cancer. Ann Oncol 2009;20:1565-75.
123. Pate JD, Gilbert CM, Bonucchi JT. Eradication of papillary thyroid carcinoma in a patient receiving pemetrexed and bevacizumAB. AACE Clin Case Rep 2020;6:e247-51.
124. Sun WY, Kim HM, Jung WH, Koo JS. Expression of serine/glycine metabolism-related proteins is different according to the thyroid cancer subtype. J Transl Med 2016;14:168.
125. Jeon MJ, You MH, Han JM, et al. High phosphoglycerate dehydrogenase expression induces stemness and aggressiveness in thyroid cancer. Thyroid 2020;30:1625-38.
126. Liao L, Ge M, Zhan Q, et al. PSPH mediates the metastasis and proliferation of non-small cell lung cancer through MAPK signaling pathways. Int J Biol Sci 2019;15:183-94.
127. Gao S, Ge A, Xu S, et al. PSAT1 is regulated by ATF4 and enhances cell proliferation via the GSK3β/β-catenin/cyclin D1 signaling pathway in ER-negative breast cancer. J Exp Clin Cancer Res 2017;36:179.
128. Dekhne AS, Hou Z, Gangjee A, Matherly LH. Therapeutic targeting of mitochondrial one-carbon metabolism in Cancer. Mol Cancer Ther ;2020:molcanther.
129. Wise DR, Thompson CB. Glutamine addiction: a new therapeutic target in cancer. Trends Biochem Sci 2010;35:427-33.
130. Kandasamy P, Gyimesi G, Kanai Y, Hediger MA. Amino acid transporters revisited: New views in health and disease. Trends Biochem Sci 2018;43:752-89.
131. Kim HM, Lee YK, Koo JS. Expression of glutamine metabolism-related proteins in thyroid cancer. Oncotarget 2016;7:53628-41.
132. Chen L, Cui H. Targeting glutamine induces apoptosis: a cancer therapy approach. Int J Mol Sci 2015;16:22830-55.
133. Chiu M, Sabino C, Taurino G, et al. GPNA inhibits the sodium-independent transport system L for neutral amino acids. Amino Acids 2017;49:1365-72.
134. Schulte ML, Fu A, Zhao P, et al. Pharmacological blockade of ASCT2-dependent glutamine transport leads to antitumor efficacy in preclinical models. Nat Med 2018;24:194-202.
135. Jin H, Wang S, Zaal EA, et al. A powerful drug combination strategy targeting glutamine addiction for the treatment of human liver cancer. Elife 2020;9:e56749.
136. Kebebew E, Wong MG, Siperstein AE, Duh QY, Clark OH. Phenylacetate inhibits growth and vascular endothelial growth factor secretion in human thyroid carcinoma cells and modulates their differentiated function. J Clin Endocrinol Metab 1999;84:2840-7.
137. Häfliger P, Graff J, Rubin M, et al. The LAT1 inhibitor JPH203 reduces growth of thyroid carcinoma in a fully immunocompetent mouse model. J Exp Clin Cancer Res 2018;37:234.
138. Enomoto K, Sato F, Tamagawa S, et al. A novel therapeutic approach for anaplastic thyroid cancer through inhibition of LAT1. Sci Rep 2019;9:14616.
139. Saha SK, Islam SMR, Abdullah-Al-Wadud M, Islam S, Ali F, Park KS. Multiomics analysis reveals that GLS and GLS2 differentially modulate the clinical outcomes of cancer. J Clin Med 2019;8:355.
140. Yu Y, Yu X, Fan C, et al. Targeting glutaminase-mediated glutamine dependence in papillary thyroid cancer. J Mol Med (Berl) 2018;96:777-90.
141. Patel D, King T, Kebebew E, Nilubol N, Boufraqech M. Glutamine metabolism is a new potential therapeutic target in aggressive thyroid cancer. J Endocr Soc 2019:3.
142. De Amicis F, Perri A, Vizza D, et al. Epigallocatechin gallate inhibits growth and epithelial-to-mesenchymal transition in human thyroid carcinoma cell lines. J Cell Physiol 2013;228:2054-62.
143. Zaballos MA, Santisteban P. Key signaling pathways in thyroid cancer. J Endocrinol 2017;235:R43-61.
144. Carnero A, Blanco-Aparicio C, Renner O, Link W, Leal JF. The PTEN/PI3K/AKT signalling pathway in cancer, therapeutic implications. Curr Cancer Drug Targets 2008;8:187-98.
145. Lien EC, Lyssiotis CA, Cantley LC. Metabolic reprogramming by the PI3K-Akt-mTOR pathway in cancer. Recent Results Cancer Res 2016;207:39-72.
146. Hoxhaj G, Manning BD. The PI3K-AKT network at the interface of oncogenic signalling and cancer metabolism. Nat Rev Cancer 2020;20:74-88.
147. Chen G, Nicula D, Renko K, Derwahl M. Synergistic anti-proliferative effect of metformin and sorafenib on growth of anaplastic thyroid cancer cells and their stem cells. Oncol Rep 2015;33:1994-2000.
148. Plews RL, Mohd Yusof A, Wang C, et al. A novel dual AMPK activator/mTOR inhibitor inhibits thyroid cancer cell growth. J Clin Endocrinol Metab 2015;100:E748-56.
149. Metformin hydrochloride in mitigating side effects of radioactive iodine treatment in patients with differentiated thyroid cancer. ClinicalTrials.gov identifier: NCT03109847. Available from: https://ClinicalTrials.gov/show/NCT03109847 [Last accessed on 23 Jun 2021].
150. Bachireddy P, Bendapudi PK, Felsher DW. Getting at MYC through RAS. Clin Cancer Res 2005;11:4278-81.
151. Miller DM, Thomas SD, Islam A, Muench D, Sedoris K. c-Myc and cancer metabolism. Clin Cancer Res 2012;18:5546-53.
152. Laplante M, Sabatini DM. Regulation of mTORC1 and its impact on gene expression at a glance. J Cell Sci 2013;126:1713-9.
153. Lee T, Yao G, Nevins J, You L. Sensing and integration of Erk and PI3K signals by Myc. PLoS Comput Biol 2008;4:e1000013.
154. Enomoto K, Zhu X, Park S, et al. Targeting MYC as a therapeutic intervention for anaplastic thyroid cancer. J Clin Endocrinol Metab 2017;102:2268-80.
155. Sakr HI, Chute DJ, Nasr C, Sturgis CD. cMYC expression in thyroid follicular cell-derived carcinomas: a role in thyroid tumorigenesis. Diagn Pathol 2017;12:71.
156. Ko YH, Verhoeven HA, Lee MJ, Corbin DJ, Vogl TJ, Pedersen PL. A translational study "case report" on the small molecule "energy blocker" 3-bromopyruvate (3BP) as a potent anticancer agent: from bench side to bedside. J Bioenerg Biomembr 2012;44:163-70.
157. Saini S, Tulla K, Maker AV, Burman KD, Prabhakar BS. Therapeutic advances in anaplastic thyroid cancer: a current perspective. Mol Cancer 2018;17:154.
158. Park C, Perini J, Farmer RW, Fancy T, Monga M, Remick SC. Sorafenib and thyroid cancer. Expert Rev Endocrinol Metab 2014;9:561-70.
159. Krajewska J, Handkiewicz-Junak D, Jarzab B. Sorafenib for the treatment of thyroid cancer: an updated review. Expert Opin Pharmacother 2015;16:573-83.
160. Borson-Chazot F, Dantony E, Illouz F, et al. Effect of buparlisib, a pan-class I PI3K inhibitor, in refractory follicular and poorly differentiated thyroid cancer. Thyroid 2018;28:1174-9.
161. Schneider TC, de Wit D, Links TP, et al. Everolimus in patients with advanced follicular-derived thyroid cancer: results of a phase II clinical trial. J Clin Endocrinol Metab 2017;102:698-707.
162. Hanna GJ, Busaidy NL, Chau NG, et al. Genomic correlates of response to everolimus in aggressive radioiodine-refractory thyroid cancer: a phase II study. Clin Cancer Res 2018;24:1546-53.
163. Harris EJ, Hanna GJ, Chau N, et al. Everolimus in anaplastic thyroid cancer: a case series. Front Oncol 2019;9:106.
Cite This Article
Export citation file: BibTeX | RIS
OAE Style
Davidson CD, Carr FE. Review of pharmacological inhibition of thyroid cancer metabolism. J Cancer Metastasis Treat 2021;7:45. http://dx.doi.org/10.20517/2394-4722.2021.77
AMA Style
Davidson CD, Carr FE. Review of pharmacological inhibition of thyroid cancer metabolism. Journal of Cancer Metastasis and Treatment. 2021; 7: 45. http://dx.doi.org/10.20517/2394-4722.2021.77
Chicago/Turabian Style
Davidson, Cole D., Frances E. Carr. 2021. "Review of pharmacological inhibition of thyroid cancer metabolism" Journal of Cancer Metastasis and Treatment. 7: 45. http://dx.doi.org/10.20517/2394-4722.2021.77
ACS Style
Davidson, CD.; Carr FE. Review of pharmacological inhibition of thyroid cancer metabolism. J. Cancer. Metastasis. Treat. 2021, 7, 45. http://dx.doi.org/10.20517/2394-4722.2021.77
About This Article
Special Issue
Copyright

Data & Comments
Data


 Cite This Article 29 clicks

 Like This Article 6
likes
Like This Article 6
likes


Comments
Comments must be written in English. Spam, offensive content, impersonation, and private information will not be permitted. If any comment is reported and identified as inappropriate content by OAE staff, the comment will be removed without notice. If you have any queries or need any help, please contact us at support@oaepublish.com.